***
slug: /tutorials/nodejs-logging-libraries
title: 5 Best Node.js Logging Libraries
'og:title': 5 Best Node.js Logging Libraries
description: >-
When an application crashes, you can read the stack trace to identify the
problem.
'og:description': >-
When an application crashes, you can read the stack trace to identify the
problem.
keywords: 'backend, engineering, observability, node.js'
--------------------------------------------------------
Published October 18, 2022

by Stanley Ulili
When an application crashes, you can read the stack trace to identify the problem.
But a stack trace only shows you the state of the application at the point of failure and not before it encountered the error.
This is where logging libraries come in.
They detail the application behavior before the point of failure and send them to your desired destination, such as a file or a [monitoring tool](/tutorials/what-is-frontend-monitoring "/tutorials/what-is-frontend-monitoring").
There are many logging libraries available for Node.js, but not all of them are created equal.
In this article, we'll take a look at the top five logging libraries for Node.js:
* [Winston](https://github.com/winstonjs/winston "https://github.com/winstonjs/winston")
* [Pino](https://github.com/pinojs/pino "https://github.com/pinojs/pino")
* [Bunyan](https://github.com/trentm/node-bunyan "https://github.com/trentm/node-bunyan")
* [Loglevel](https://github.com/pimterry/loglevel "https://github.com/pimterry/loglevel")
* [Npmlog](https://github.com/npm/npmlog "https://github.com/npm/npmlog")
We'll analyze them based on their features and popularity to help you choose the right one for your needs. But first, let's establish why you'd even want to use a logging library for Node.js.
## Why Use Logging Libraries for Node.js?
Node.js ships with the [console API](https://developer.mozilla.org/en-US/docs/Web/API/Console_API "https://developer.mozilla.org/en-US/docs/Web/API/Console_API"), which contains methods that can be used for logging. But the logs tend to be difficult to read or filter since they are in a text format.
Most logging tools provide JSON support out of the box, and you can easily add dates, sort, or send logs to your desired destinations.
Consider the following example that uses the console API:
```
console.log("log");
console.info("custom message");
console.warn("Warning message");
console.trace("a stack trace");
```
When you run the program, you will see an output that looks like the following:
```
// Output:
log
custom message
warning message
Trace: a stack trace
at Object....
...
```
Now imagine if you had hundreds of these messages.
Not only would be difficult to know the message level or the date the messages were logged, but filtering and sorting the logs would also be a demanding task.
Now let's compare the output above with a Node.js logging library's output:
```
{"level":"error","message":"Error message","timestamp":"2022-09-20T11:39:33.953Z"}
{"level":"warn","message":"Warning message","timestamp":"2022-09-20T11:39:33.957Z"}
{"level":"info","message":"Info message","timestamp":"2022-09-20T11:39:33.957Z"}
```
Right off the bat, the output is in JSON format, which is easily machine-readable.
And this means you can send your logs to a variety of destinations. For example, you can send it [to LaunchDarkly](https://launchdarkly.com "https://launchdarkly.com").
The `level` field tells you the level each message belongs to at a glance. Most libraries support the following levels(ordered from the most severe to the least severe):
* `fatal`: indicates a serious problem that can stop the application from running
* `error`: used to indicate that a required task failed
* `warn`: indicates something that may cause a problem
* `info`: used for messages that confirm that the application is behaving as it should
* `debug`: used for messages that help when diagnosing an issue
Another interesting option in the output is the `timestamp` property, which tells you the date the message was logged. Since the logs are in JSON format, programs can use the date to easily filter or sort the messages.
On top of that, the logging tools also allow you to specify the destination you want to save your logs. You can even configure them to send logs to a specific file, database, or even cloud tools.
Now that you know why you should be using a logging library, we'll go over the five best Node.js logging libraries.
## 5 Best Node.js Logging Libraries
### #1 Winston
[Winston](https://github.com/winstonjs/winston "https://github.com/winstonjs/winston") is a popular, feature-rich, and flexible logging library for Node.js. The default format it uses is JSON, but it can be configured to send logs in multiple storage devices called transports.
Winston currently has 7 million weekly downloads on npm and 19 thousand stars on GitHub, making it the most-starred logging library in Node.js.
Here are some of Winston's features:
* JSON format: it creates JSON logs, which are easier to parse, sort, or filter
* Multiple transports: Winston can send logs to files, databases, the console, or tools like [AWS CloudWatch](https://aws.amazon.com/cloudwatch/ "https://aws.amazon.com/cloudwatch/") or [Graylog](https://www.graylog.org/ "https://www.graylog.org/")
* Supports [child loggers](https://www.npmjs.com/package/winston#creating-child-loggers "https://www.npmjs.com/package/winston#creating-child-loggers")
* Allows you to [query logs](https://www.npmjs.com/package/winston#querying-logs "https://www.npmjs.com/package/winston#querying-logs")
* Supports Node.js streams
* Supports creating custom levels
#### **How to Use Winston**
To install Winston, enter the following command in your terminal:
`npm install winston`
Once you've installed it, create a `winston_demo.js` file and add the following code:
```
const winston = require("winston");
const logger = winston.createLogger({
transports: [new winston.transports.Console()],
});
logger.error("Error message");
logger.warn("Warning message");
logger.info("Info message");
logger.verbose("Verbose message");
logger.debug("Debug message");
logger.silly("Silly message");
```
To create a Winston logger, you invoke Winston's `createLogger()` method with a configuration object as its argument. You then assign the object a `transports` property with an instance of `Console()` so that Winston should send all logs to the console. Finally, you call the appropriate level method for each message you want to log.
Winston has seven [levels](https://github.com/winstonjs/winston#using-logging-levels "https://github.com/winstonjs/winston#using-logging-levels") (ordered from the most to least important): `error`, `warn`, `info`, `verbose`, `debug`, and `silly`.
When you run the program:
`node winston_demo.js`
It yields output that looks like the following:
```
// Output:
{"level":"error","message":"Error message"}
{"level":"warn","message":"Warning message"}
{"level":"info","message":"Info message"}
```
Winston logs only messages in levels from `info` to `error`. To see all messages, you have to assign a `level` property to the config object:
```
...
const logger = winston.createLogger({
level: "silly",
transports: [new winston.transports.Console()],
})
...
```
Currently, the code in our `winston_demo.js` file prints JSON logs without dates. To add dates, you can use the [`format`](https://github.com/winstonjs/winston#formats "https://github.com/winstonjs/winston#formats") option in the config object:
```
const winston = require("winston");
const logger = winston.createLogger({
level: "info",
format: winston.format.combine(
winston.format.timestamp(), // adds a timestamp property
winston.format.json()
),
transports: [new winston.transports.Console()],
});
logger.error("Error message");
logger.warn("Warning message");
logger.info("Info message");
// Output:
//
// {"level":"error","message":"Error message","timestamp":"2022-09-21T09:00:00.426Z"}
// {"level":"warn","message":"Warning message","timestamp":"2022-09-21T09:00:00.428Z"}
// {"level":"info","message":"Info message","timestamp":"2022-09-21T09:00:00.429Z"}
```
Winston also allows you to specify the file you want to send the logs to, as well as the level:
```
const winston = require("winston");
const logger = winston.createLogger({
level: "info",
format: winston.format.combine(
winston.format.timestamp(),
winston.format.json()
),
transports: [
new winston.transports.File({ filename: "error.log", level: "warn" }),
new winston.transports.File({ filename: "app.log" }),
],
});
logger.error("Error message");
logger.warn("Warning message");
logger.info("Info message");
```
After running the file, you will find that two files have been created: `error.log` and `app.log`.
When you open `error.log`, you will see error and warning logs only:
```
{"level":"error","message":"Error message","timestamp":"2022-09-21T09:01:45.843Z"}
{"level":"warn","message":"Warning message","timestamp":"2022-09-21T09:01:45.846Z"}
```
When you inspect `app.log`, you will see the following:
```
{"level":"error","message":"Error message","timestamp":"2022-09-21T09:01:45.843Z"}
{"level":"warn","message":"Warning message","timestamp":"2022-09-21T09:01:45.846Z"}
{"level":"info","message":"Info message","timestamp":"2022-09-21T09:01:45.846Z"}
```
You now have a general idea of how Winston works. But there's so much more to unpack in the [Winston documentation](https://github.com/winstonjs/winston "https://github.com/winstonjs/winston") on Github.
### #**2 Pino**
[Pino](https://github.com/pinojs/pino "https://github.com/pinojs/pino") is another popular JSON logging tool. It is more lightweight and claims to be 5x faster than other logging libraries. At the time of writing, it has 3 million weekly downloads on npm and has 10K Github stars.
The following are some of the features :
* Transports: you can use Pino to send logs to files, the console, or tools like [Sentry](https://sentry.io/ "https://sentry.io/"), [Azure Application Insights](https://docs.microsoft.com/en-us/azure/azure-monitor/app/app-insights-overview "https://docs.microsoft.com/en-us/azure/azure-monitor/app/app-insights-overview"), [CouchDB](https://couchdb.apache.org/ "https://couchdb.apache.org/"), etc. See Pino's [Known Transports](https://github.com/pinojs/pino/blob/HEAD/docs/transports.md#known-transports "https://github.com/pinojs/pino/blob/HEAD/docs/transports.md#known-transports") section for more details.
* [Web frameworks](https://getpino.io/#/docs/web "https://getpino.io/#/docs/web") support: Pino has modules that support logging in popular Node.js web frameworks, such as [Express](https://expressjs.com/ "https://expressjs.com/"), [Fastify](https://www.fastify.io/ "https://www.fastify.io/"), [Hapi](https://hapi.dev/ "https://hapi.dev/"), etc.
* [Browser API](https://github.com/pinojs/pino/blob/master/docs/browser.md#browser-api "https://github.com/pinojs/pino/blob/master/docs/browser.md#browser-api"): Pino can be used for logging in the browser environment
* Creating child loggers
* Pretty printing with the [`pino-pretty`](https://github.com/pinojs/pino-pretty "https://github.com/pinojs/pino-pretty") module
#### **How to Use Pino**
First, install Pino with the following command in a new directory:
`npm install pino`
Next, create a `logger.js` file to initialize the logger:
```
const pino = require("pino");
module.exports = pino({});
```
To initialize the logger, you call the `pino()` function with a configuration object. You can leave the object empty for now.
Next, create a `pino_demo.js` file with the following contents:
```
const logger = require("./logger");
logger.fatal("Fatal message");
logger.error("Error message");
logger.warn("Warn message");
logger.info("Info message");
logger.debug("Debug message");
logger.trace("Trace message");
// Output:
// {"level":60,"time":1663751177889,"pid":39927,"hostname":"node","msg":"Fatal message"}
// {"level":50,"time":1663751177890,"pid":39927,"hostname":"node","msg":"Error message"}
// {"level":40,"time":1663751177890,"pid":39927,"hostname":"node","msg":"Warn message"}
// {"level":30,"time":1663751177890,"pid":39927,"hostname":"node","msg":"Info message"}
```
In the output, Pino prints messages from only `fatal` to `info`. To see all levels, you can specify the `level` property in the config object:
```
...
module.exports = pino(
{
level: "info",
})
```
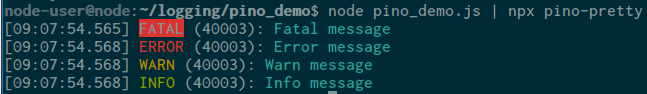
If you want to format and colorize the output during development, you can install the `pino-pretty` module:
`npm install pino-pretty --save-dev`
To use it, pipe the commands as follows:
`node pino_demo.js | npx pino-pretty`
As mentioned, you can configure Pino to send logs to other transports (storage devices). To do that, you can use Node.js streams with the help of the `fs` module.
Open `logger.js` and add the following:
{/* cSpell:disable */}
```
const pino = require("pino");
const fs = require("fs");
const streams = [
{
level: "info", // log INFO and above
stream: fs.createWriteStream("./app.log", { flags: "a" }),
},
{
level: "error", // log INFO and above
stream: fs.createWriteStream("./error.log", { flags: "a" }),
},
];
module.exports = pino(
{
level: "info",
},
pino.multistream(streams)
);
```
{/* cSpell:enable */}
When you save and run the file, you will see that two files in your directory have been created that contain the log contents.
Now that you know the basics of using Pino, see [Pino's documentation](https://getpino.io/#/ "https://getpino.io/#/") to learn more.
### #3 **Bunyan**
[Bunyan](https://github.com/trentm/node-bunyan "https://github.com/trentm/node-bunyan") is another invaluable tool that can be used for logging. It is a strong advocate of JSON logs and currently has 1.7 million weekly downloads on npm and 6.9K Github stars.
Bunyan provides a simple API alongside many useful features:
* Transports: using Nodejs streams, you can configure `bunyan` to send logs to the console, files, streams, etc.
* Pretty printing: `bunyan` provides a CLI for prettifying and filtering logs
* Supports multiple runtime environments, such as \[Node.js], [Browserify](http://browserify.org/ "http://browserify.org/"), [Webpack](https://webpack.github.io/ "https://webpack.github.io/"), and [Nw.js](http://nwjs.io/ "http://nwjs.io/")
* Child loggers
* Node.js streams support
#### **How to Use Bunyan**
In a new directory, install Bunyan via npm:
`npm install bunyan`
Next, create a file `bunyan_demo.js` with the following:
```
const bunyan = require("bunyan");
const log = bunyan.createLogger({ name: "demo_app" });
log.fatal("Fatal message");
log.error("Error message");
log.warn("Warn message");
log.info("Info message");
log.debug("Debug message");
log.trace("Trace message");
```
In the preceding code block, you invoke Bunyan's `createLogger()` method with a configuration object as an argument. You then assign the application name using the `name` property.
Now, run the file:
`node bunyan_demo.js`
You will see output that looks like the following:
```
// Output:
{"name":"demo_app","hostname":"node","pid":40239,"level":60,"msg":"Fatal message","time":"2022-09-21T09:22:11.541Z","v":0}
{"name":"demo_app","hostname":"node","pid":40239,"level":50,"msg":"Error message","time":"2022-09-21T09:22:11.542Z","v":0}
{"name":"demo_app","hostname":"node","pid":40239,"level":40,"msg":"Warn message","time":"2022-09-21T09:22:11.542Z","v":0}
{"name":"demo_app","hostname":"node","pid":40239,"level":30,"msg":"Info message","time":"2022-09-21T09:22:11.542Z","v":0}
```
Similar to Winston and Pino, Bunyan only logs from `info` level and goes up to the `fatal` level. You can use the `level` property to change this behavior.
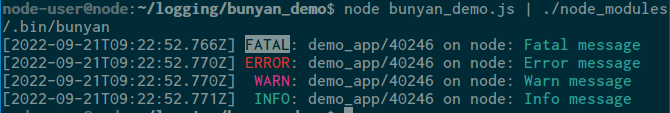
You can also make use of the Bunyan CLI to tidy the output:
`node bunyan_demo.js | ./node_modules/.bin/bunyan`
To configure Bunyan to send logs to files, you can use the `streams` property, which accepts an array of transports:
```
const bunyan = require("bunyan");
const log = bunyan.createLogger({
name: "demo_app",
streams: [
{
level: "info", // log INFO and above
path: "./app.log",
},
{
level: "error", // log ERROR and above
path: "./error.log",
},
],
});
log.fatal("Fatal message");
log.error("Error message");
log.warn("Warn message");
log.info("Info message");
```
The errors are sent to the `error.log` file, and the rest are sent to the `app.log`.
To continue exploring the Bunyan Node.js logging library, visit their [documentation](https://github.com/trentm/node-bunyan "https://github.com/trentm/node-bunyan") page.
### #4 **Loglevel**
Loglevel is a lightweight logging library, and currently has 9 million weekly downloads on npm and 2.3K stars on Github.
But it lacks a lot of features available in the logging tools we have looked at so far, notably native JSON support.
Depending on your use case, it has some features worth considering:
* Can be embedded in the browser.
* It is a single file with no dependencies.
* Can be extended with plugins to redirect logs, format, or filter logs. Some popular plugins are [loglevel-plugin-prefix](https://www.npmjs.com/package/loglevel-plugin-prefix "https://www.npmjs.com/package/loglevel-plugin-prefix"), and [loglevel-plugin-remote](https://www.npmjs.com/package/loglevel-plugin-remote "https://www.npmjs.com/package/loglevel-plugin-remote").
#### **How to Use Loglevel**
First, install loglevel in a new directory:
`npm install loglevel`
Create a `loglevel_demo.js` file with the following contents:
```
log = require("loglevel");
log.setLevel("info");
log.info("Info message");
log.warn("Warn message");
log.error("Error message");
```
When you run the file, you will see an output resembling the following:
```
Info message
Warn message
Error message
```
As you can see, it is much easier to set up and use in your project. However, the logs are not in JSON format, which can make filtering difficult.
If you want to learn more about Loglevel, visit the [documentation page](https://github.com/pimterry/loglevel "https://github.com/pimterry/loglevel") on Github.
### #5 **Npmlog**
Last on our list is [npmlog](https://github.com/npm/npmlog "https://github.com/npm/npmlog"), a logging tool used by the npm project. It currently has 23 million weekly downloads and 390 stars on GitHub.
Npmlog is simple and lightweight, making it a great option for beginners.
Here are some of the features:
* Colorized output in the terminal
* Ability to define custom levels
#### **How to Use Npmlog**
First, install the `npmlog` library:
`npm install npmlog`
Next, create a `npmlog_demo.js` file:
```
const log = require("npmlog");
log.silly("Silly message");
log.verbose("Verbose Message");
log.info("Prefix", "Info Message");
log.http("HTTP message");
log.warn("Warning message");
const errorCode = 500;
log.error("Error", "Message: %d", errorCode);
```
Running the file yields output that looks like this:
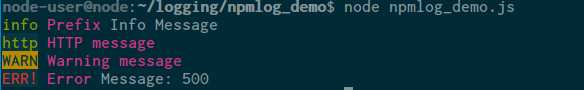
From the output, only levels from `info` to `error` are logged. Also, note that the output is colorized allowing you to differentiate the messages. However, since Npmlog doesn't use the JSON format, it can be a huge drawback, especially when you want to sort or filter them.
If you want `npmlog` to show all the messages, you can use the `level` property:
```
const log = require("npmlog");
log.level = "silly"
...
```
You can also define your custom levels:
```
const log = require("npmlog");
// define a level
log.addLevel("success", 2000, { fg: "green" });
// using your custom level
log.success("Prefix", "success message");
// success Prefix success message
```
To save logs in a file, you can use the `npmlog-file` library. To use it, install `npmlog-file` in your directory:
`npm install npmlog-file`
Next, add the following code to your file like so:
{/* cSpell:disable */}
```
const log = require("npmlog");
// import npmlogfile
const logfile = require("npmlog-file");
const errorCode = 500;
log.info("Prefix", "Info Message");
log.http("HTTP message");
log.warn("Warning message");
log.error("Error", "Message: %d", errorCode);
// write logs to the "app.log" file
logfile.write(log, "app.log");
```
{/* cSpell:enable */}
When running the file, you will find the `app.log` created with the log contents.
To explore npmlog, visit the [npmlog documentation](https://github.com/npm/npmlog "https://github.com/npm/npmlog").
## Streamline Your Debugging Process With Node.Js Logging Libraries
If you're looking for a fast and efficient way to [debug your Node.js applications](/tutorials/the-debugging-process-and-techniques-for-web-applications-part-1-2 "/tutorials/the-debugging-process-and-techniques-for-web-applications-part-1-2"), consider using one of the libraries we discussed in this article.
Each library has its own unique set of features that can help [streamline your debugging process](/tutorials/the-debugging-process-and-techniques-for-web-applications-part-2-2 "/tutorials/the-debugging-process-and-techniques-for-web-applications-part-2-2"). But we do have to recommend Winston, Pino, or Bunyan due to their popularity and ease of use.
These logging libraries have proved to be invaluable when it comes to debugging Node.js applications in development and production environments.
And when paired with a monitoring tool like [LaunchDarkly,](https://launchdarkly.com/ "https://launchdarkly.com/") they can provide you with even more insights into your Node.js applications.