> ## Documentation Index
> Fetch the complete documentation index at: https://launchdarkly.com/docs/llms.txt
> Use this file to discover all available pages before exploring further.
# Using the Metrics list
This topic explains how to use the **Metrics** list to view, search, and filter metrics in your project.
The **Metrics** list is the central location for reviewing and managing all metrics in a project. From this list, you can find metrics by name, tag, maintainer, or type, and understand how they connect to experiments, guarded rollouts, and metric groups. To learn how to create, edit, archive, or delete metrics, read [Creating and managing metrics](/docs/home/metrics/create-metrics).
The list displays indicators that help you understand how each metric is performing, how many experiments and guarded rollouts use the metric, which feature last used the metric, and whether the metric is still receiving event data.
**Archived metrics are hidden**
By default, LaunchDarkly hides archived metrics from the **Metrics** list, experiment setup screens, and metric selection menus. To view them, turn on the **Show archived** filter in the **Metrics** list.
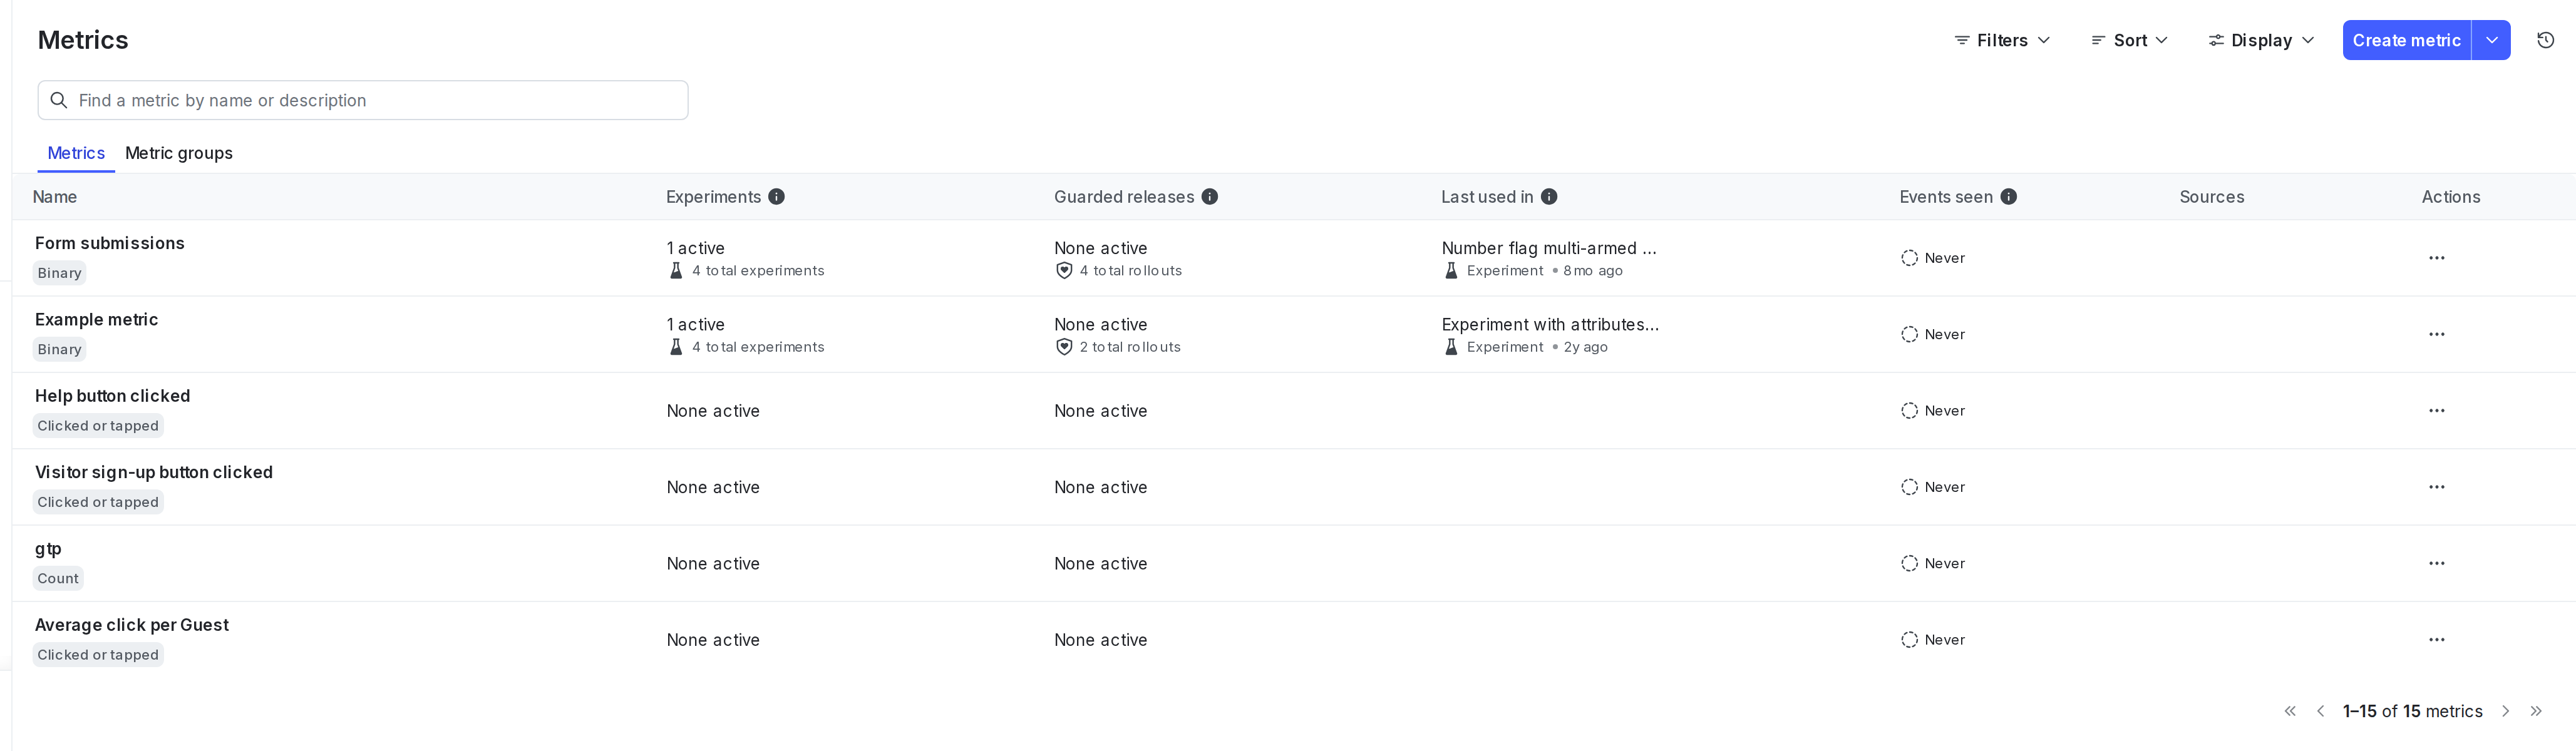 In the left sidebar, expand **Data**, then select **Metrics** to open the metrics list.
Metrics in the list are labeled by their type: "Page view", "Clicked or tapped", "Binary", "Count", or "Numeric". Metrics that are connected to a guarded rollout are labeled with "Release guardrail".
Each row in the list provides high-level information about a metric’s usage and activity within the selected project and environment.
## Table columns
By default, the table displays the following columns for both individual metrics and metric groups:
* **Experiments**: summarizes the number of experiments that use the metric.
* **Guarded releases**: summarizes the number of guarded rollouts that use the metric.
* **Last used in**: shows the most recent experiment or guarded rollout that used the metric.
* **Events seen**: shows when LaunchDarkly last received an event for the metric. Metrics that have not received events recently may be inactive or misconfigured.
* **Sources**: the SDK or data source that instruments events for the metric. For example, metrics created from OpenTelemetry traces show "Traces" in this column.
* **Actions**: A menu that allows you to copy the metric's key, or to clone or archive the metric.
You can also display additional columns:
* **Total connections**: the total number of connections this metric has to metric groups, multi-armed bandits, experiments, guarded releases, and release policies.
* **Created on**: the creation date for the metric.
You can show or hide any of the columns, including the default ones.
Use tooltips to learn more about each column. For example, hovering over **Connected experiments** or **Connected guarded releases** shows the count of active connections grouped by environment.
### Accessing the Metrics list
Open the **Metrics** list from the left sidebar under **Data**.
## Using the list
You can use the **Metrics** list to search, filter, sort, and customize how metrics appear in your project.
### Search and browse metrics
You can search for metrics by any of the following attributes:
* Metric name
* Description
* Metric key
This allows you to find metrics even when you only remember their underlying event or partial description.
Select a metric name to open its details page and review its configuration, connections, and activity. To learn more about metric details, read [Creating and managing metrics](/docs/home/metrics/create-metrics).
### Filter metrics
Filters help you focus the list on metrics most relevant to your work. You can apply multiple filters at the same time.
Available filters include:
* **Tags**: limit the list to metrics with specific tags.
* **Metric used in**: filter by where a metric is used:
* **Any**: metrics used in experiments or guarded rollouts.
* **Experiments**: metrics connected only to experiments.
* **Guarded rollouts**: metrics connected only to guarded rollouts.
* **None**: metrics not connected to any feature.
* **Maintainer**: show metrics maintained by a specific team member.
* **Type**: filter by metric kind, such as "Clicked or tapped", "Page view", or custom "Count", "Binary", or "Numeric" metrics.
* **Has connections**: show metrics based on whether they have active connections.
* **Archived**: show archived metrics if archiving is enabled.
The filter bar remains visible while you browse so you can adjust filters without leaving the list.
### Sort metrics
Sorting helps you prioritize metrics based on activity and usage.
By default, the list sorts metrics by **Most active connections**, which ranks metrics according to how many active experiments or guarded rollouts they are part of.
You can also sort metrics by:
* **Newest** or **Oldest**: sorts by the metric creation date.
* **Name A-Z** or **Name Z-A**: sorts by the metric name.
* **Most connections** or **Fewest connections**: sorts by the most or fewest total connections.
Sorting by activity surfaces the most widely used and trusted metrics, so you can reuse proven definitions instead of creating new ones.
### Show or hide columns
Use options in the **Display** menu to customize columns to show or hide in the table for both metrics and metric groups. By default, the table displays **Experiments**, **Guarded releases**, **Last used in**, **Events seen**, and **Sources**. You can also display **Total connections** and **Created on**.
Your selections are stored in your browser's local storage and persist between sessions. This lets you tailor the list to focus on the information that matters most to your role or workflow.
## Understanding metric details and actions
The **Metrics** list provides rich information at a glance to help you understand each metric's activity and connections across your project. Tooltips for column values provide additional details about metrics and their use in LaunchDarkly features. You can also perform quick actions with metrics that you discover in the **Metrics** list.
### Metric definition
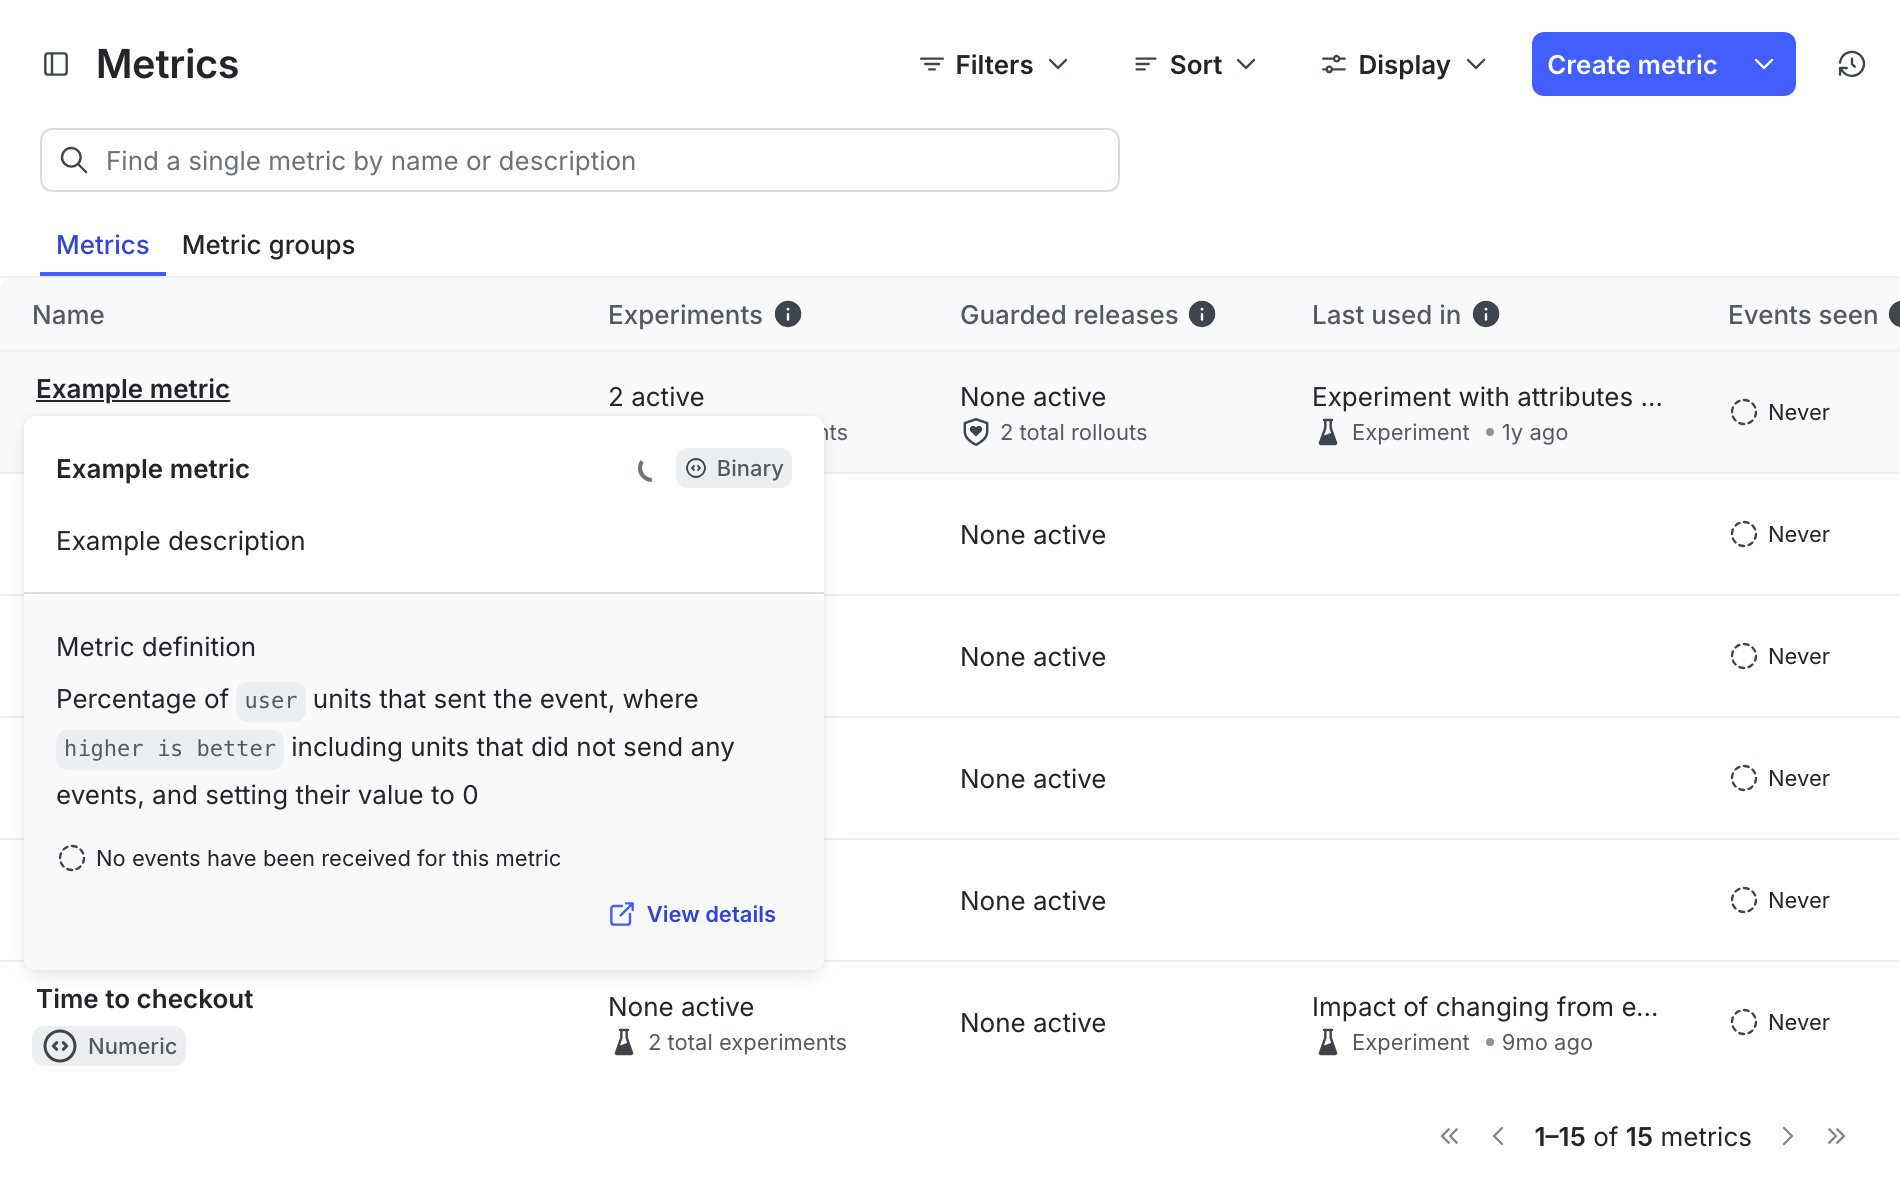
Entries in the "Name" column show the metric name and type, as well as any tags associated with the metric. Clicking a tag automatically filters the metric list by that tag. Tooltips show the complete definition for the metric.
In the left sidebar, expand **Data**, then select **Metrics** to open the metrics list.
Metrics in the list are labeled by their type: "Page view", "Clicked or tapped", "Binary", "Count", or "Numeric". Metrics that are connected to a guarded rollout are labeled with "Release guardrail".
Each row in the list provides high-level information about a metric’s usage and activity within the selected project and environment.
## Table columns
By default, the table displays the following columns for both individual metrics and metric groups:
* **Experiments**: summarizes the number of experiments that use the metric.
* **Guarded releases**: summarizes the number of guarded rollouts that use the metric.
* **Last used in**: shows the most recent experiment or guarded rollout that used the metric.
* **Events seen**: shows when LaunchDarkly last received an event for the metric. Metrics that have not received events recently may be inactive or misconfigured.
* **Sources**: the SDK or data source that instruments events for the metric. For example, metrics created from OpenTelemetry traces show "Traces" in this column.
* **Actions**: A menu that allows you to copy the metric's key, or to clone or archive the metric.
You can also display additional columns:
* **Total connections**: the total number of connections this metric has to metric groups, multi-armed bandits, experiments, guarded releases, and release policies.
* **Created on**: the creation date for the metric.
You can show or hide any of the columns, including the default ones.
Use tooltips to learn more about each column. For example, hovering over **Connected experiments** or **Connected guarded releases** shows the count of active connections grouped by environment.
### Accessing the Metrics list
Open the **Metrics** list from the left sidebar under **Data**.
## Using the list
You can use the **Metrics** list to search, filter, sort, and customize how metrics appear in your project.
### Search and browse metrics
You can search for metrics by any of the following attributes:
* Metric name
* Description
* Metric key
This allows you to find metrics even when you only remember their underlying event or partial description.
Select a metric name to open its details page and review its configuration, connections, and activity. To learn more about metric details, read [Creating and managing metrics](/docs/home/metrics/create-metrics).
### Filter metrics
Filters help you focus the list on metrics most relevant to your work. You can apply multiple filters at the same time.
Available filters include:
* **Tags**: limit the list to metrics with specific tags.
* **Metric used in**: filter by where a metric is used:
* **Any**: metrics used in experiments or guarded rollouts.
* **Experiments**: metrics connected only to experiments.
* **Guarded rollouts**: metrics connected only to guarded rollouts.
* **None**: metrics not connected to any feature.
* **Maintainer**: show metrics maintained by a specific team member.
* **Type**: filter by metric kind, such as "Clicked or tapped", "Page view", or custom "Count", "Binary", or "Numeric" metrics.
* **Has connections**: show metrics based on whether they have active connections.
* **Archived**: show archived metrics if archiving is enabled.
The filter bar remains visible while you browse so you can adjust filters without leaving the list.
### Sort metrics
Sorting helps you prioritize metrics based on activity and usage.
By default, the list sorts metrics by **Most active connections**, which ranks metrics according to how many active experiments or guarded rollouts they are part of.
You can also sort metrics by:
* **Newest** or **Oldest**: sorts by the metric creation date.
* **Name A-Z** or **Name Z-A**: sorts by the metric name.
* **Most connections** or **Fewest connections**: sorts by the most or fewest total connections.
Sorting by activity surfaces the most widely used and trusted metrics, so you can reuse proven definitions instead of creating new ones.
### Show or hide columns
Use options in the **Display** menu to customize columns to show or hide in the table for both metrics and metric groups. By default, the table displays **Experiments**, **Guarded releases**, **Last used in**, **Events seen**, and **Sources**. You can also display **Total connections** and **Created on**.
Your selections are stored in your browser's local storage and persist between sessions. This lets you tailor the list to focus on the information that matters most to your role or workflow.
## Understanding metric details and actions
The **Metrics** list provides rich information at a glance to help you understand each metric's activity and connections across your project. Tooltips for column values provide additional details about metrics and their use in LaunchDarkly features. You can also perform quick actions with metrics that you discover in the **Metrics** list.
### Metric definition
Entries in the "Name" column show the metric name and type, as well as any tags associated with the metric. Clicking a tag automatically filters the metric list by that tag. Tooltips show the complete definition for the metric.
 ### Metric usage
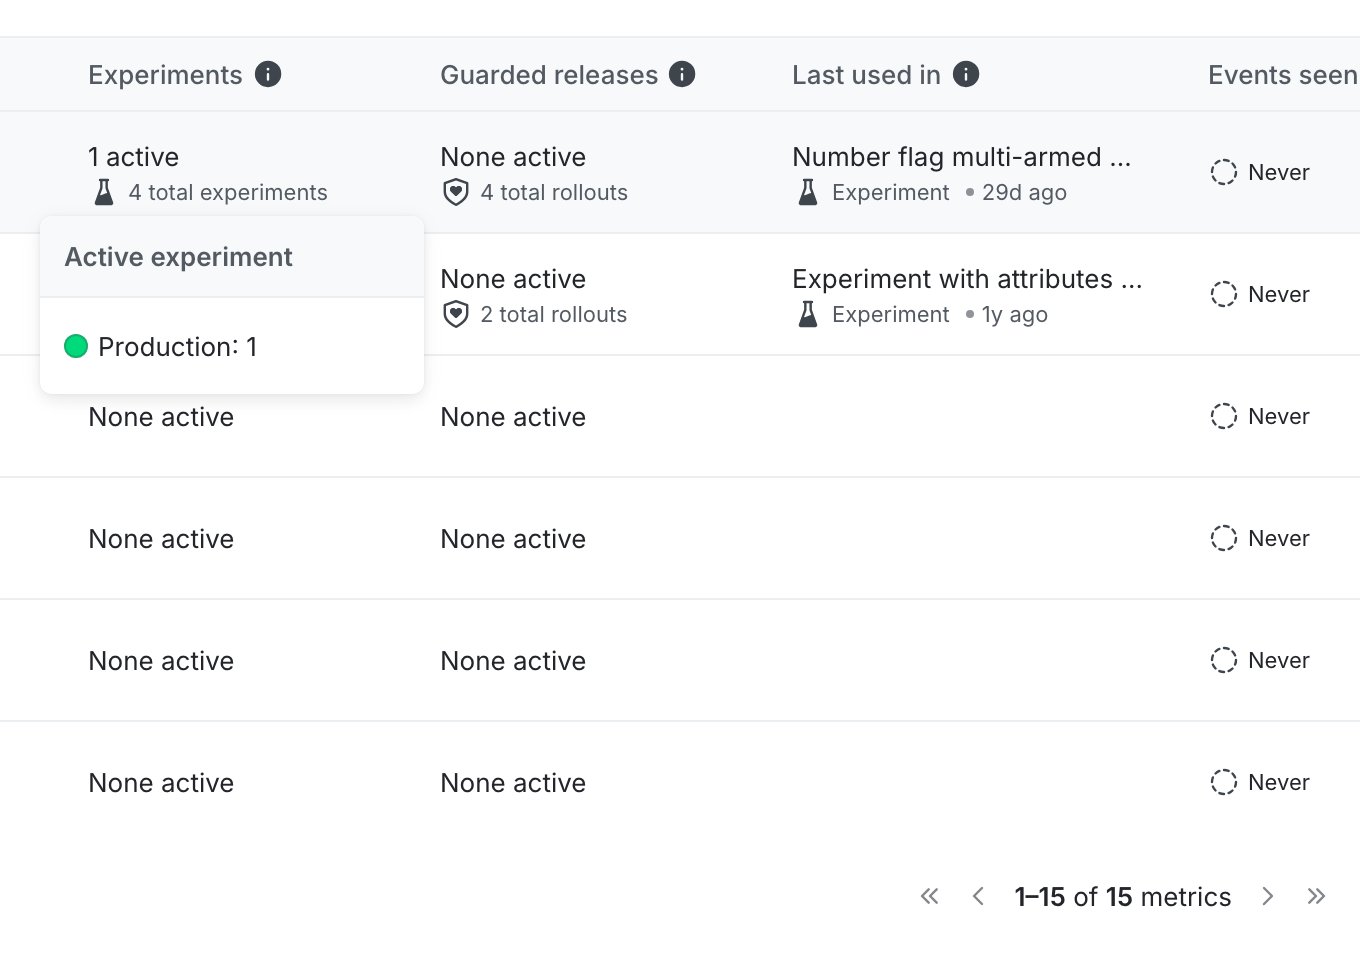
Entries in the "Experiments" and "Guarded releases" columns highlight the metric's use and activity in LaunchDarkly features, to promote discoverability and trust. Tooltips show the environment(s) where the metric is active in an experiment or guarded rollout.
### Metric usage
Entries in the "Experiments" and "Guarded releases" columns highlight the metric's use and activity in LaunchDarkly features, to promote discoverability and trust. Tooltips show the environment(s) where the metric is active in an experiment or guarded rollout.
 ### Actions
You can use the drop-down menu in the "Actions" column to copy a metric's key or clone the metric definition, creating a new metric. You can archive the metric if was never connected to an experiment or guarded rollout. Active, event-rich metrics are generally safer to reuse across teams.
### Tabs in the metrics section
The metrics section includes several tabs for viewing related resources:
* **Metrics** is the default list of individual metrics.
* **Metric groups** are reusable collections of metrics that standardize measurement across teams. To learn more, read [Metric groups](/docs/home/metrics/metric-groups).
These tabs help you navigate between related metrics resources in one place.
## Next steps
After you find the metric you want to work with, you can:
* [Create or edit metrics](/docs/home/metrics/create-metrics)
* [Review metric activity and event data](/docs/home/metrics/metric-events)
* [Analyze metric definitions and results](/docs/home/metrics/components)
* [Group related metrics for reuse](/docs/home/metrics/metric-groups)
### Actions
You can use the drop-down menu in the "Actions" column to copy a metric's key or clone the metric definition, creating a new metric. You can archive the metric if was never connected to an experiment or guarded rollout. Active, event-rich metrics are generally safer to reuse across teams.
### Tabs in the metrics section
The metrics section includes several tabs for viewing related resources:
* **Metrics** is the default list of individual metrics.
* **Metric groups** are reusable collections of metrics that standardize measurement across teams. To learn more, read [Metric groups](/docs/home/metrics/metric-groups).
These tabs help you navigate between related metrics resources in one place.
## Next steps
After you find the metric you want to work with, you can:
* [Create or edit metrics](/docs/home/metrics/create-metrics)
* [Review metric activity and event data](/docs/home/metrics/metric-events)
* [Analyze metric definitions and results](/docs/home/metrics/components)
* [Group related metrics for reuse](/docs/home/metrics/metric-groups)