> ## Documentation Index
> Fetch the complete documentation index at: https://launchdarkly.com/docs/llms.txt
> Use this file to discover all available pages before exploring further.
# Viewing incoming events
This topic explains how to view metric events your SDKs are sending to LaunchDarkly, and how to create metrics from those events.
An event occurs when an end user performs an action in your app, such as clicking a button, or when a system performs an action, such as processing a background job. Your SDKs can send these events to LaunchDarkly, where LaunchDarkly metrics aggregate and analyze them. To learn more, read [Events](/docs/home/metrics/metric-events).
## View events from your SDKs
Before you create a metric, you can view the events your SDKs are already sending to LaunchDarkly in the event explorer. The event explorer helps you identify which events your SDKs send and decide what event keys to use when creating metrics.
To view events from your SDKs, expand **Data**, then select **Event explorer** in the left sidebar. The event list displays the 25 most recent event keys received in the selected environment during the last 90 days.
 Each event entry displays the following information:
* The event key
* A trend line showing the number of events received each day for the last 14 days
* The total number of events received over the last 14 days, and the percent change from the previous 14-day period
* All environments within the current project that have received the event
* The SDK or other external source that sent the event
* Any metrics already associated with the event
* The option to create a new metric using the event key
To copy an event key, click the **three-dot** overflow menu for an event and select **Copy event key**.
### View event details
Click an event key to view more details about the event. A side panel opens with the options to view event details and preview recent events.
The **Event details** tab displays:
* A trend line showing the number of events received each day for the last 14 days
* The context kinds associated with the event, with a count of unique keys for each context kind
* Information about when the event was last seen in each of its environments
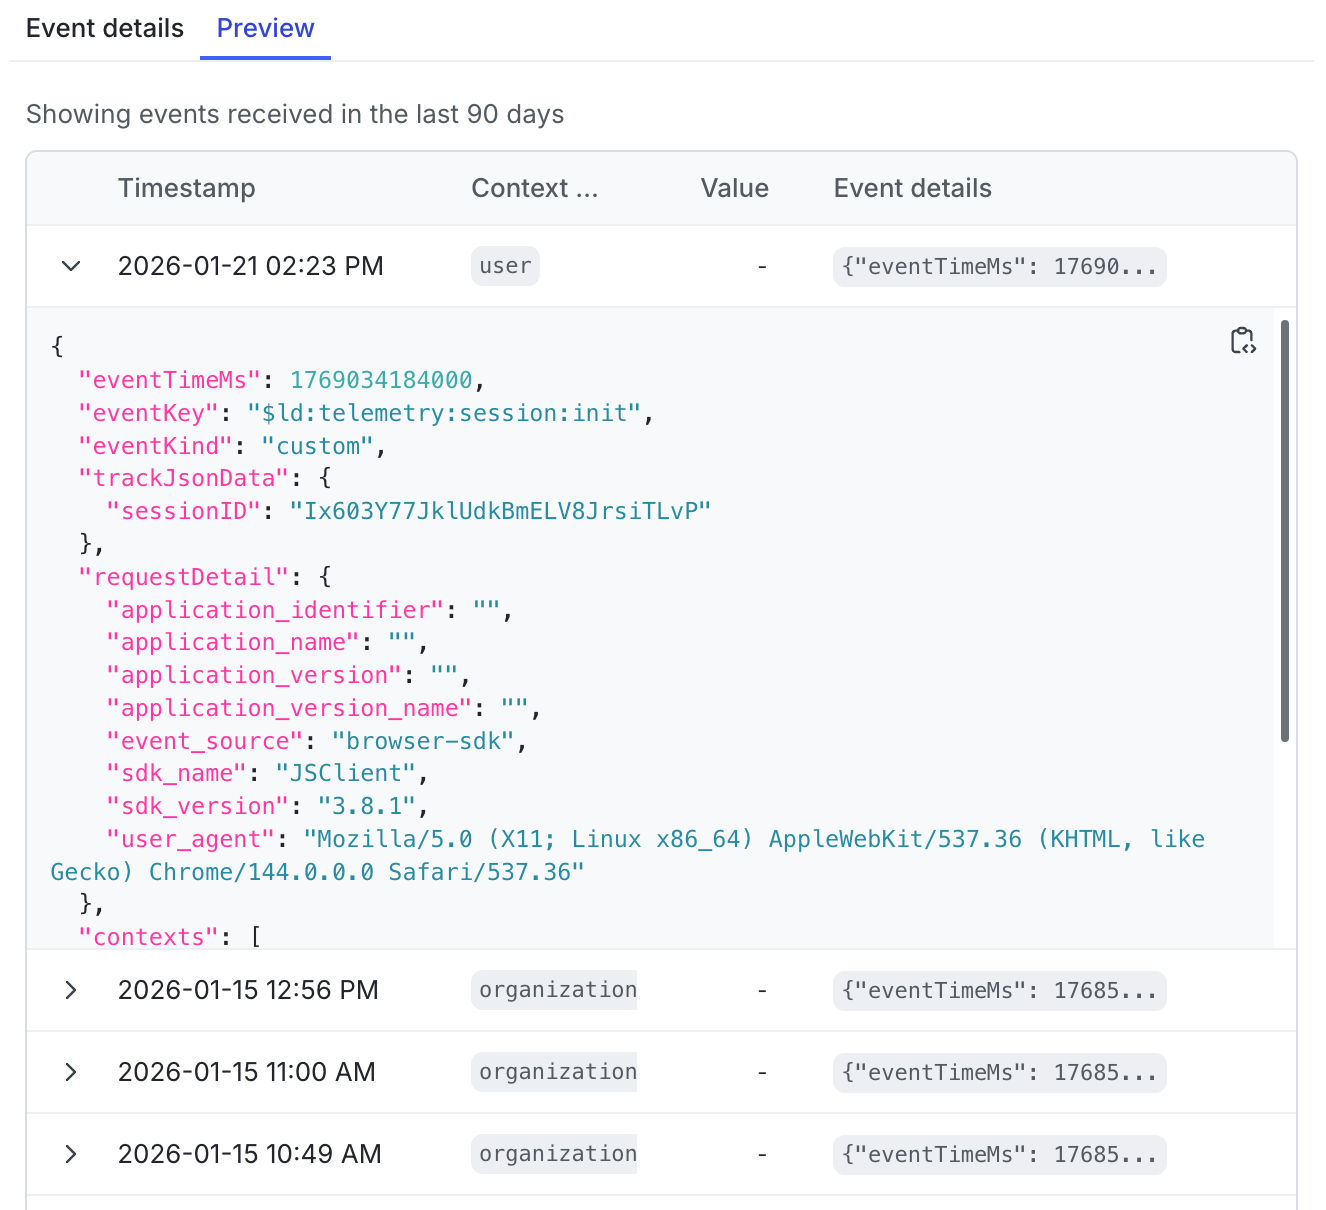
The **Preview** tab displays a list of events that were received over the last 90 days. Expand the timestamp of an event to view complete event details, such as information about the SDK, SDK version, event source, and application, if applicable.
Each event entry displays the following information:
* The event key
* A trend line showing the number of events received each day for the last 14 days
* The total number of events received over the last 14 days, and the percent change from the previous 14-day period
* All environments within the current project that have received the event
* The SDK or other external source that sent the event
* Any metrics already associated with the event
* The option to create a new metric using the event key
To copy an event key, click the **three-dot** overflow menu for an event and select **Copy event key**.
### View event details
Click an event key to view more details about the event. A side panel opens with the options to view event details and preview recent events.
The **Event details** tab displays:
* A trend line showing the number of events received each day for the last 14 days
* The context kinds associated with the event, with a count of unique keys for each context kind
* Information about when the event was last seen in each of its environments
The **Preview** tab displays a list of events that were received over the last 90 days. Expand the timestamp of an event to view complete event details, such as information about the SDK, SDK version, event source, and application, if applicable.
 **Display limitations for warehouse native events**
Metric events that are stored in an external warehouse, such as BigQuery, Databricks, Redshift, or Snowflake, do not display a list of recent events in the **Preview** tab or the number of unique keys associated with each context kind for the event in the **Event details** tab.
## Create metrics from existing events
To create a metric from an existing event:
1. Navigate to the event explorer list by expanding **Data** then clicking **Event explorer** in the left sidebar.
2. Find the event you want to create a metric for:
* If the event has no metrics associated with it, click **Create new metric**.
* If the event already has an associated metric, click the **three-dot** overflow menu for an event and select **Create new metric**.
3. Follow the instructions in the [Create metrics](/docs/home/metrics/create-metrics) topic to create a new metric. For custom conversion binary, custom conversion count, and custom numeric metrics, the **Event key** field is automatically populated with the event key from the event you chose.
After you create the metric, it appears in the **Metrics** list.
You can also create a new metric from an event by clicking **Create new metric** at the bottom of its event details panel.
## Metric event filtering
All events that LaunchDarkly receives appear in the event explorer, whether or not they are included in a metric.
To include only a specific subset of events in a metric, apply filters after the metric is created. Metric event filtering does not affect what you see in the event explorer or event details panel. It only affects which events are counted when LaunchDarkly analyzes the metric's impact.
To learn more, read [Filtering custom metric events](/docs/home/metrics/event-filters).
**Display limitations for warehouse native events**
Metric events that are stored in an external warehouse, such as BigQuery, Databricks, Redshift, or Snowflake, do not display a list of recent events in the **Preview** tab or the number of unique keys associated with each context kind for the event in the **Event details** tab.
## Create metrics from existing events
To create a metric from an existing event:
1. Navigate to the event explorer list by expanding **Data** then clicking **Event explorer** in the left sidebar.
2. Find the event you want to create a metric for:
* If the event has no metrics associated with it, click **Create new metric**.
* If the event already has an associated metric, click the **three-dot** overflow menu for an event and select **Create new metric**.
3. Follow the instructions in the [Create metrics](/docs/home/metrics/create-metrics) topic to create a new metric. For custom conversion binary, custom conversion count, and custom numeric metrics, the **Event key** field is automatically populated with the event key from the event you chose.
After you create the metric, it appears in the **Metrics** list.
You can also create a new metric from an event by clicking **Create new metric** at the bottom of its event details panel.
## Metric event filtering
All events that LaunchDarkly receives appear in the event explorer, whether or not they are included in a metric.
To include only a specific subset of events in a metric, apply filters after the metric is created. Metric event filtering does not affect what you see in the event explorer or event details panel. It only affects which events are counted when LaunchDarkly analyzes the metric's impact.
To learn more, read [Filtering custom metric events](/docs/home/metrics/event-filters).