 ### The Metrics tab
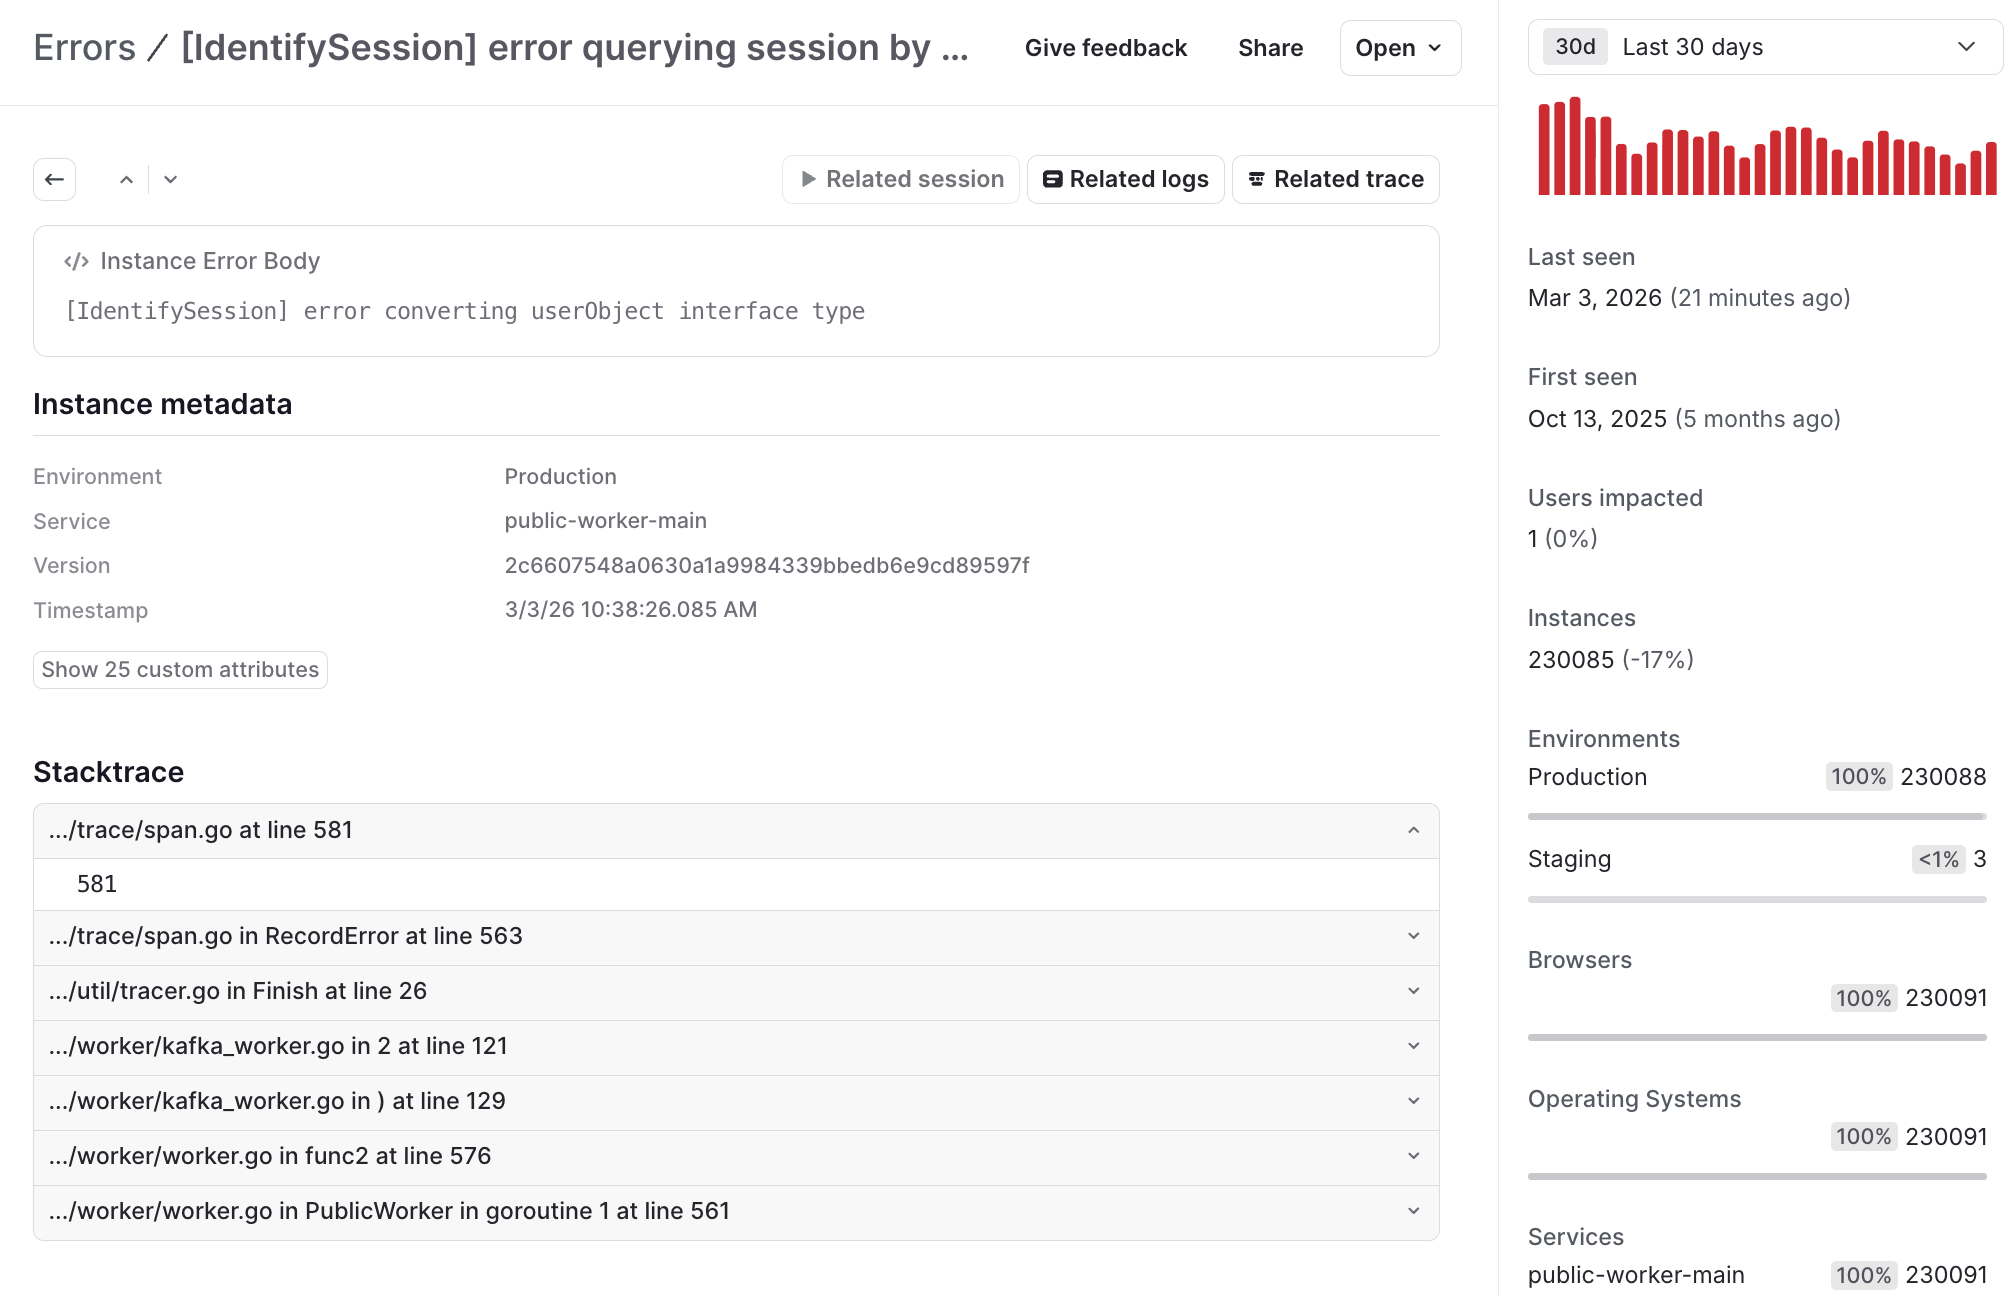
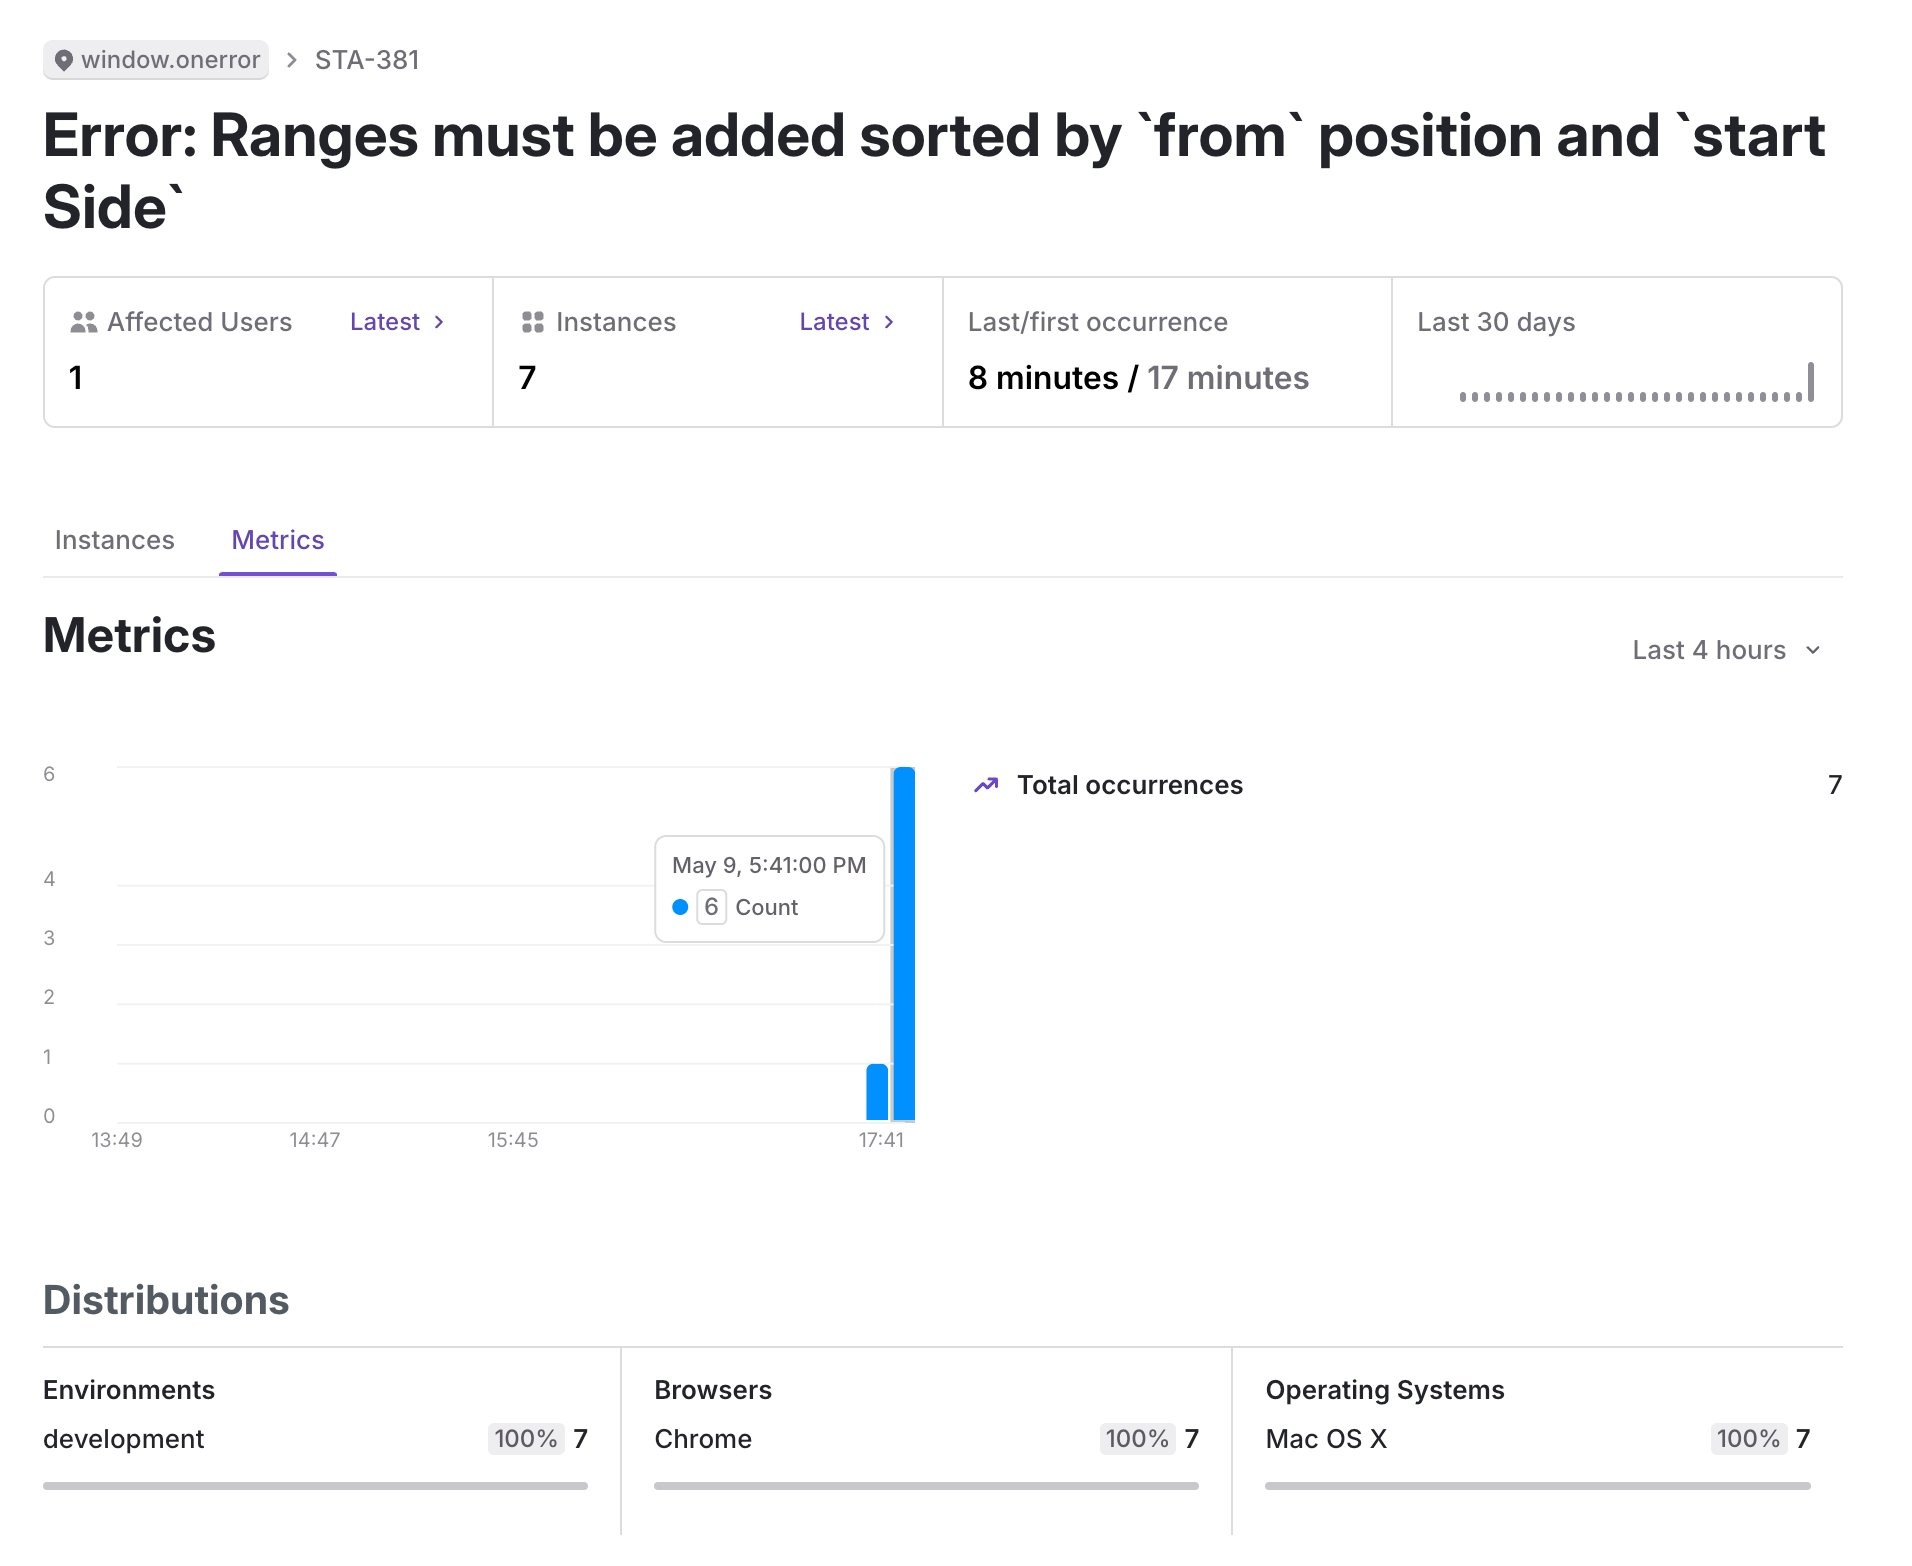
An error's **Metrics** tab shows you details about how the error has occurred over time and across different environments. You can see the number of times an error has occurred in a given second, the environments and browsers the error has occurred in, and more.
### The Metrics tab
An error's **Metrics** tab shows you details about how the error has occurred over time and across different environments. You can see the number of times an error has occurred in a given second, the environments and browsers the error has occurred in, and more.
 ## Group errors
LaunchDarkly groups errors together based on their error message and stack trace. When your application throws an error, LaunchDarkly finds the closest matching error and adds the new error instance to it.
An error matches if:
* it has the same error message, or
* it has the same top stack frame and three of the next four stack frames are the same, in any order
A stack frame matches if:
* it has the same file name, function name, line number, and column number, or
* it has the same source code and context, if [sourcemaps](#the-instances-tab) are enabled
If there is no match with an existing error, LaunchDarkly creates a new error group.
## Manage errors
As you review errors, you can change their status.
To change the status of an error:
1. Open the **Telemetry** section and navigate to the **Errors** list.
2. Click to select an individual error. New errors start with an "Open" status.
3. Click the status dropdown to change the status:
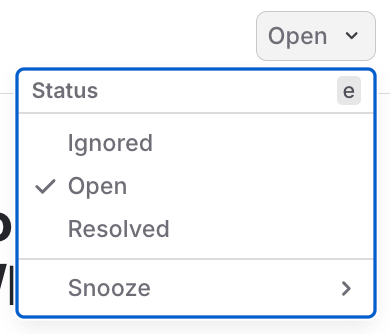
* Select a new status from the menu. You can change an error's status to "Ignored" or "Resolved."
* Select **Snooze** to snooze the error until the specified time.
## Group errors
LaunchDarkly groups errors together based on their error message and stack trace. When your application throws an error, LaunchDarkly finds the closest matching error and adds the new error instance to it.
An error matches if:
* it has the same error message, or
* it has the same top stack frame and three of the next four stack frames are the same, in any order
A stack frame matches if:
* it has the same file name, function name, line number, and column number, or
* it has the same source code and context, if [sourcemaps](#the-instances-tab) are enabled
If there is no match with an existing error, LaunchDarkly creates a new error group.
## Manage errors
As you review errors, you can change their status.
To change the status of an error:
1. Open the **Telemetry** section and navigate to the **Errors** list.
2. Click to select an individual error. New errors start with an "Open" status.
3. Click the status dropdown to change the status:
* Select a new status from the menu. You can change an error's status to "Ignored" or "Resolved."
* Select **Snooze** to snooze the error until the specified time.
 You can also configure LaunchDarkly to automatically resolve errors that have not appeared for a given time period. To learn how, read [Observability settings](/docs/home/observability/settings).
If your account uses the Jira Cloud integration, you can create a Jira issue directly from an error to track the work to fix it. To learn how, read [Create a Jira issue from an error](/docs/integrations/jira#create-a-jira-issue-from-an-error).
## Search
To learn more about the search specification for the errors view, read [Search specification](/docs/home/observability/search).
### Search attributes
By default, the observability SDK plugin automatically injects the following attributes to provide additional help with searching for traces:
You can also configure LaunchDarkly to automatically resolve errors that have not appeared for a given time period. To learn how, read [Observability settings](/docs/home/observability/settings).
If your account uses the Jira Cloud integration, you can create a Jira issue directly from an error to track the work to fix it. To learn how, read [Create a Jira issue from an error](/docs/integrations/jira#create-a-jira-issue-from-an-error).
## Search
To learn more about the search specification for the errors view, read [Search specification](/docs/home/observability/search).
### Search attributes
By default, the observability SDK plugin automatically injects the following attributes to provide additional help with searching for traces:
| Category | Attribute | Description | Example |
|---|---|---|---|
| Device and browser | `browser` | Browser the end user was using. | `Chrome` |
| `visited_url` | URL where the error occurred. | `https://app.example.com/1/errors` | |
| Error identity | `event` | The title of the error. | `Maximum call stack size exceeded` |
| `client_id` | ID associated with the error, added by LaunchDarkly. This can serve as a unique identifier if there is no [context](/docs/home/flags/contexts) associated with the error. | `DQbQCEHN0FLuwCeW50AeLI0cH6C4` | |
| `secure_session_id` | Session ID that contains the error. | `wh1jcuN5F9G6Ra5CKeCjdIk6Rbyd` | |
| `trace_id` | Trace ID that contains this error. | `7654ff38c4631d5a51b26f7e637eea3c` | |
| Error properties | `status` | Status of the error group. | `RESOLVED` |
| `stack_trace` | Specifies whether a stack trace is associated with the error. You can refine results with the following additional attributes: `error`, `file_name`, `function_name`, `line_number`. | `true` | |
| `tag` | Tag applied to the error. | `example error` | |
| `type` | General type of the error. | `React.ErrorBoundary` | |
| Feature flag | `feature_flag` | Specifies whether the session is associated with a feature flag. You can refine results with the following additional attributes: `context.id`, `contextKeys`, `key`, `provider.name`, `result.reason.inExperiment`, `result.reason.kind`, `result.value`, and `set.id`. | `true` |
| Service and application | `environment` | The environment key, based on the SDK credentials used in the [observability SDKs](/docs/sdk/observability). | `production` |
| `has_session` | Whether the error is tied to a session. | `true` | |
| `service_name` | Name of the service specified in the SDK plugin. To learn more, read [Versioning sessions and errors](/docs/sdk/features/observability-config-client-side#versioning-sessions-and-errors). | `private-graph` | |
| `service_version` | Version of the service specified in the observability SDK plugin. To learn more, read [Versioning sessions and errors](/docs/sdk/features/observability-config-client-side#versioning-sessions-and-errors). | `e1845285cb360410aee05c61dd0cc57f85afe6da` |