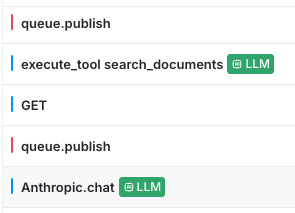
 ### About LLM conversations
A single agent run rarely fits into one trace. A typical agent run involves a variety of activities that generate multiple traces over a period of time, such as:
* Answering a question
* Calling one or more tools to perform tasks or gather information
* Waiting for a person to reply, or for a tool call to return data
* Repeating these actions minutes or hours later after new information becomes available
Because each of these activities arrives as a separate trace, reading a single, logical conversation with an LLM requires organizing and connecting the different activities span-by-span.
LaunchDarkly automatically stitches together all spans that share a common conversation identifier. It orders the messages and tool calls into a single, readable transcript. LaunchDarkly also rolls up key attributes such as the duration, token usage, models, and errors across the entire agent run.
You can use LaunchDarkly LLM conversations to browse and display full agent runs as they occurred in response to user prompts and tool responses. Conversations also work as a starting point to dive into span information at any turn in the conversation to learn details about problems or errors that occurred when interacting with an agent.
## Set up LLM observability
To set up LLM observability, you configure a LaunchDarkly observability SDK in your application to instrument the generative AI attributes LaunchDarkly reads on each span. The steps vary by SDK and by LLM provider.
To learn more about instrumenting your application so LLM spans and conversations render correctly, read [Instrumenting LLM applications](/docs/sdk/features/observability-llm-instrumentation).
### Associate traces with AgentControl
LLM observability captures spans for any instrumented model call. When you use LaunchDarkly AgentControl together with the LaunchDarkly Observability plugin and spans are successfully exported, LaunchDarkly associates traces with the AgentControl config that generated them.
The AI SDK annotates the root span with the underlying feature flag key for the evaluated config. LaunchDarkly uses this annotation to link related spans to the correct config when spans are exported through the Observability SDK.
With this integration, you can:
* Filter traces by config key or variation
* Correlate model behavior with variations and targeting
* Investigate latency, errors, and quality signals in context
If you do not use the LaunchDarkly Observability SDK, you can still associate traces with AgentControl by adding span attributes in your tracing pipeline. For example, attach the AgentControl config key and evaluated variation to the root span when your application calls the model provider.
## View and analyze LLM spans
LaunchDarkly displays LLM observability data in two places:
* The **Monitoring** tab on a config, when spans relate to that config
* The global **Traces** page
Each view serves a different purpose.
### View traces for a specific config
To view trace data for a config:
1. Click **Agents**. The AgentControl menu appears.
2. Click **Configs**.
3. Open the **Monitoring** tab.
If LaunchDarkly links spans to that config, it displays them in this panel.
### About LLM conversations
A single agent run rarely fits into one trace. A typical agent run involves a variety of activities that generate multiple traces over a period of time, such as:
* Answering a question
* Calling one or more tools to perform tasks or gather information
* Waiting for a person to reply, or for a tool call to return data
* Repeating these actions minutes or hours later after new information becomes available
Because each of these activities arrives as a separate trace, reading a single, logical conversation with an LLM requires organizing and connecting the different activities span-by-span.
LaunchDarkly automatically stitches together all spans that share a common conversation identifier. It orders the messages and tool calls into a single, readable transcript. LaunchDarkly also rolls up key attributes such as the duration, token usage, models, and errors across the entire agent run.
You can use LaunchDarkly LLM conversations to browse and display full agent runs as they occurred in response to user prompts and tool responses. Conversations also work as a starting point to dive into span information at any turn in the conversation to learn details about problems or errors that occurred when interacting with an agent.
## Set up LLM observability
To set up LLM observability, you configure a LaunchDarkly observability SDK in your application to instrument the generative AI attributes LaunchDarkly reads on each span. The steps vary by SDK and by LLM provider.
To learn more about instrumenting your application so LLM spans and conversations render correctly, read [Instrumenting LLM applications](/docs/sdk/features/observability-llm-instrumentation).
### Associate traces with AgentControl
LLM observability captures spans for any instrumented model call. When you use LaunchDarkly AgentControl together with the LaunchDarkly Observability plugin and spans are successfully exported, LaunchDarkly associates traces with the AgentControl config that generated them.
The AI SDK annotates the root span with the underlying feature flag key for the evaluated config. LaunchDarkly uses this annotation to link related spans to the correct config when spans are exported through the Observability SDK.
With this integration, you can:
* Filter traces by config key or variation
* Correlate model behavior with variations and targeting
* Investigate latency, errors, and quality signals in context
If you do not use the LaunchDarkly Observability SDK, you can still associate traces with AgentControl by adding span attributes in your tracing pipeline. For example, attach the AgentControl config key and evaluated variation to the root span when your application calls the model provider.
## View and analyze LLM spans
LaunchDarkly displays LLM observability data in two places:
* The **Monitoring** tab on a config, when spans relate to that config
* The global **Traces** page
Each view serves a different purpose.
### View traces for a specific config
To view trace data for a config:
1. Click **Agents**. The AgentControl menu appears.
2. Click **Configs**.
3. Open the **Monitoring** tab.
If LaunchDarkly links spans to that config, it displays them in this panel.
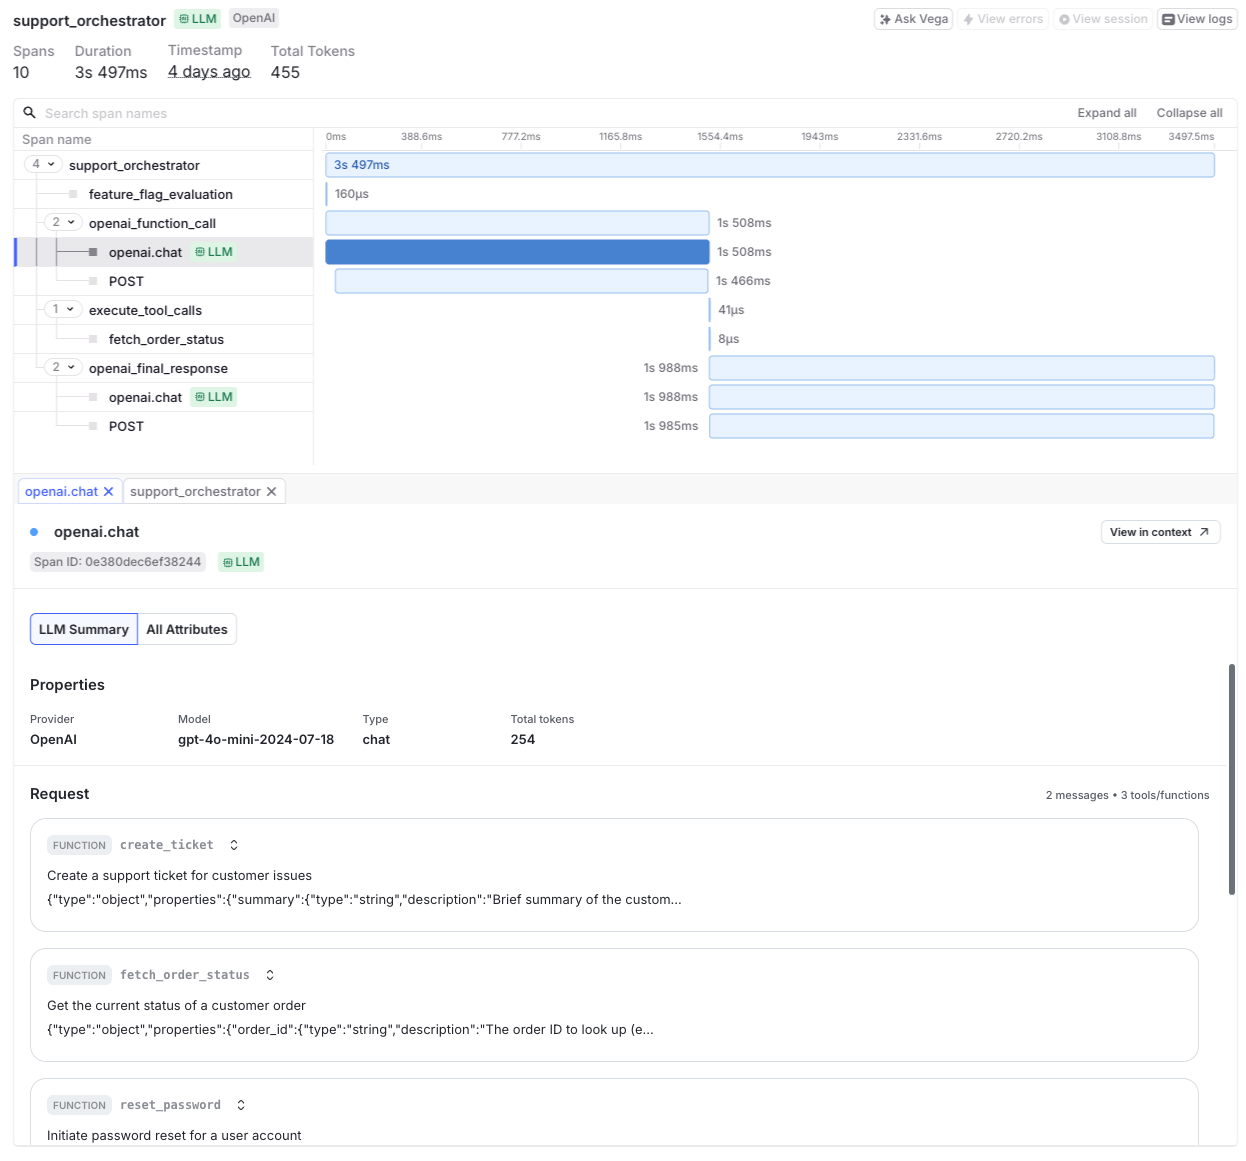 Use the search bar, filters, and time range selector to analyze spans. The trace detail panel shows a timeline of generation steps and related spans, provider and model metadata such as latency and token usage, prompt and response content, and any provider errors or exceptions.
### Filter on LLM span attributes
LaunchDarkly builds LLM observability and conversation views from the OpenTelemetry generative AI semantic conventions. It normalizes several common non-standard formats when it receives them, including the OpenLLMetry `llm.*` attributes and Claude Code telemetry. Search and display use the normalized names, so filter on the names below rather than the names your instrumentation emits.
LLM spans include the following attributes:
* `gen_ai.request.model`: The model that handled the request.
* `gen_ai.provider.name`: The provider that handled the request.
* `gen_ai.usage.input_tokens`: The number of input tokens processed.
* `gen_ai.usage.output_tokens`: The number of tokens in the output.
* `gen_ai.prompt.0.content`: The input prompt text. Subsequent messages use increasing indexes.
* `gen_ai.completion.0.content`: The generated response. Subsequent responses use increasing indexes.
* `duration`: The total latency of the span.
* `service.name`: The name of the emitting service.
Use these attributes to filter, search, and investigate model behavior. For example, to find slow requests to a specific model:
Use the search bar, filters, and time range selector to analyze spans. The trace detail panel shows a timeline of generation steps and related spans, provider and model metadata such as latency and token usage, prompt and response content, and any provider errors or exceptions.
### Filter on LLM span attributes
LaunchDarkly builds LLM observability and conversation views from the OpenTelemetry generative AI semantic conventions. It normalizes several common non-standard formats when it receives them, including the OpenLLMetry `llm.*` attributes and Claude Code telemetry. Search and display use the normalized names, so filter on the names below rather than the names your instrumentation emits.
LLM spans include the following attributes:
* `gen_ai.request.model`: The model that handled the request.
* `gen_ai.provider.name`: The provider that handled the request.
* `gen_ai.usage.input_tokens`: The number of input tokens processed.
* `gen_ai.usage.output_tokens`: The number of tokens in the output.
* `gen_ai.prompt.0.content`: The input prompt text. Subsequent messages use increasing indexes.
* `gen_ai.completion.0.content`: The generated response. Subsequent responses use increasing indexes.
* `duration`: The total latency of the span.
* `service.name`: The name of the emitting service.
Use these attributes to filter, search, and investigate model behavior. For example, to find slow requests to a specific model:
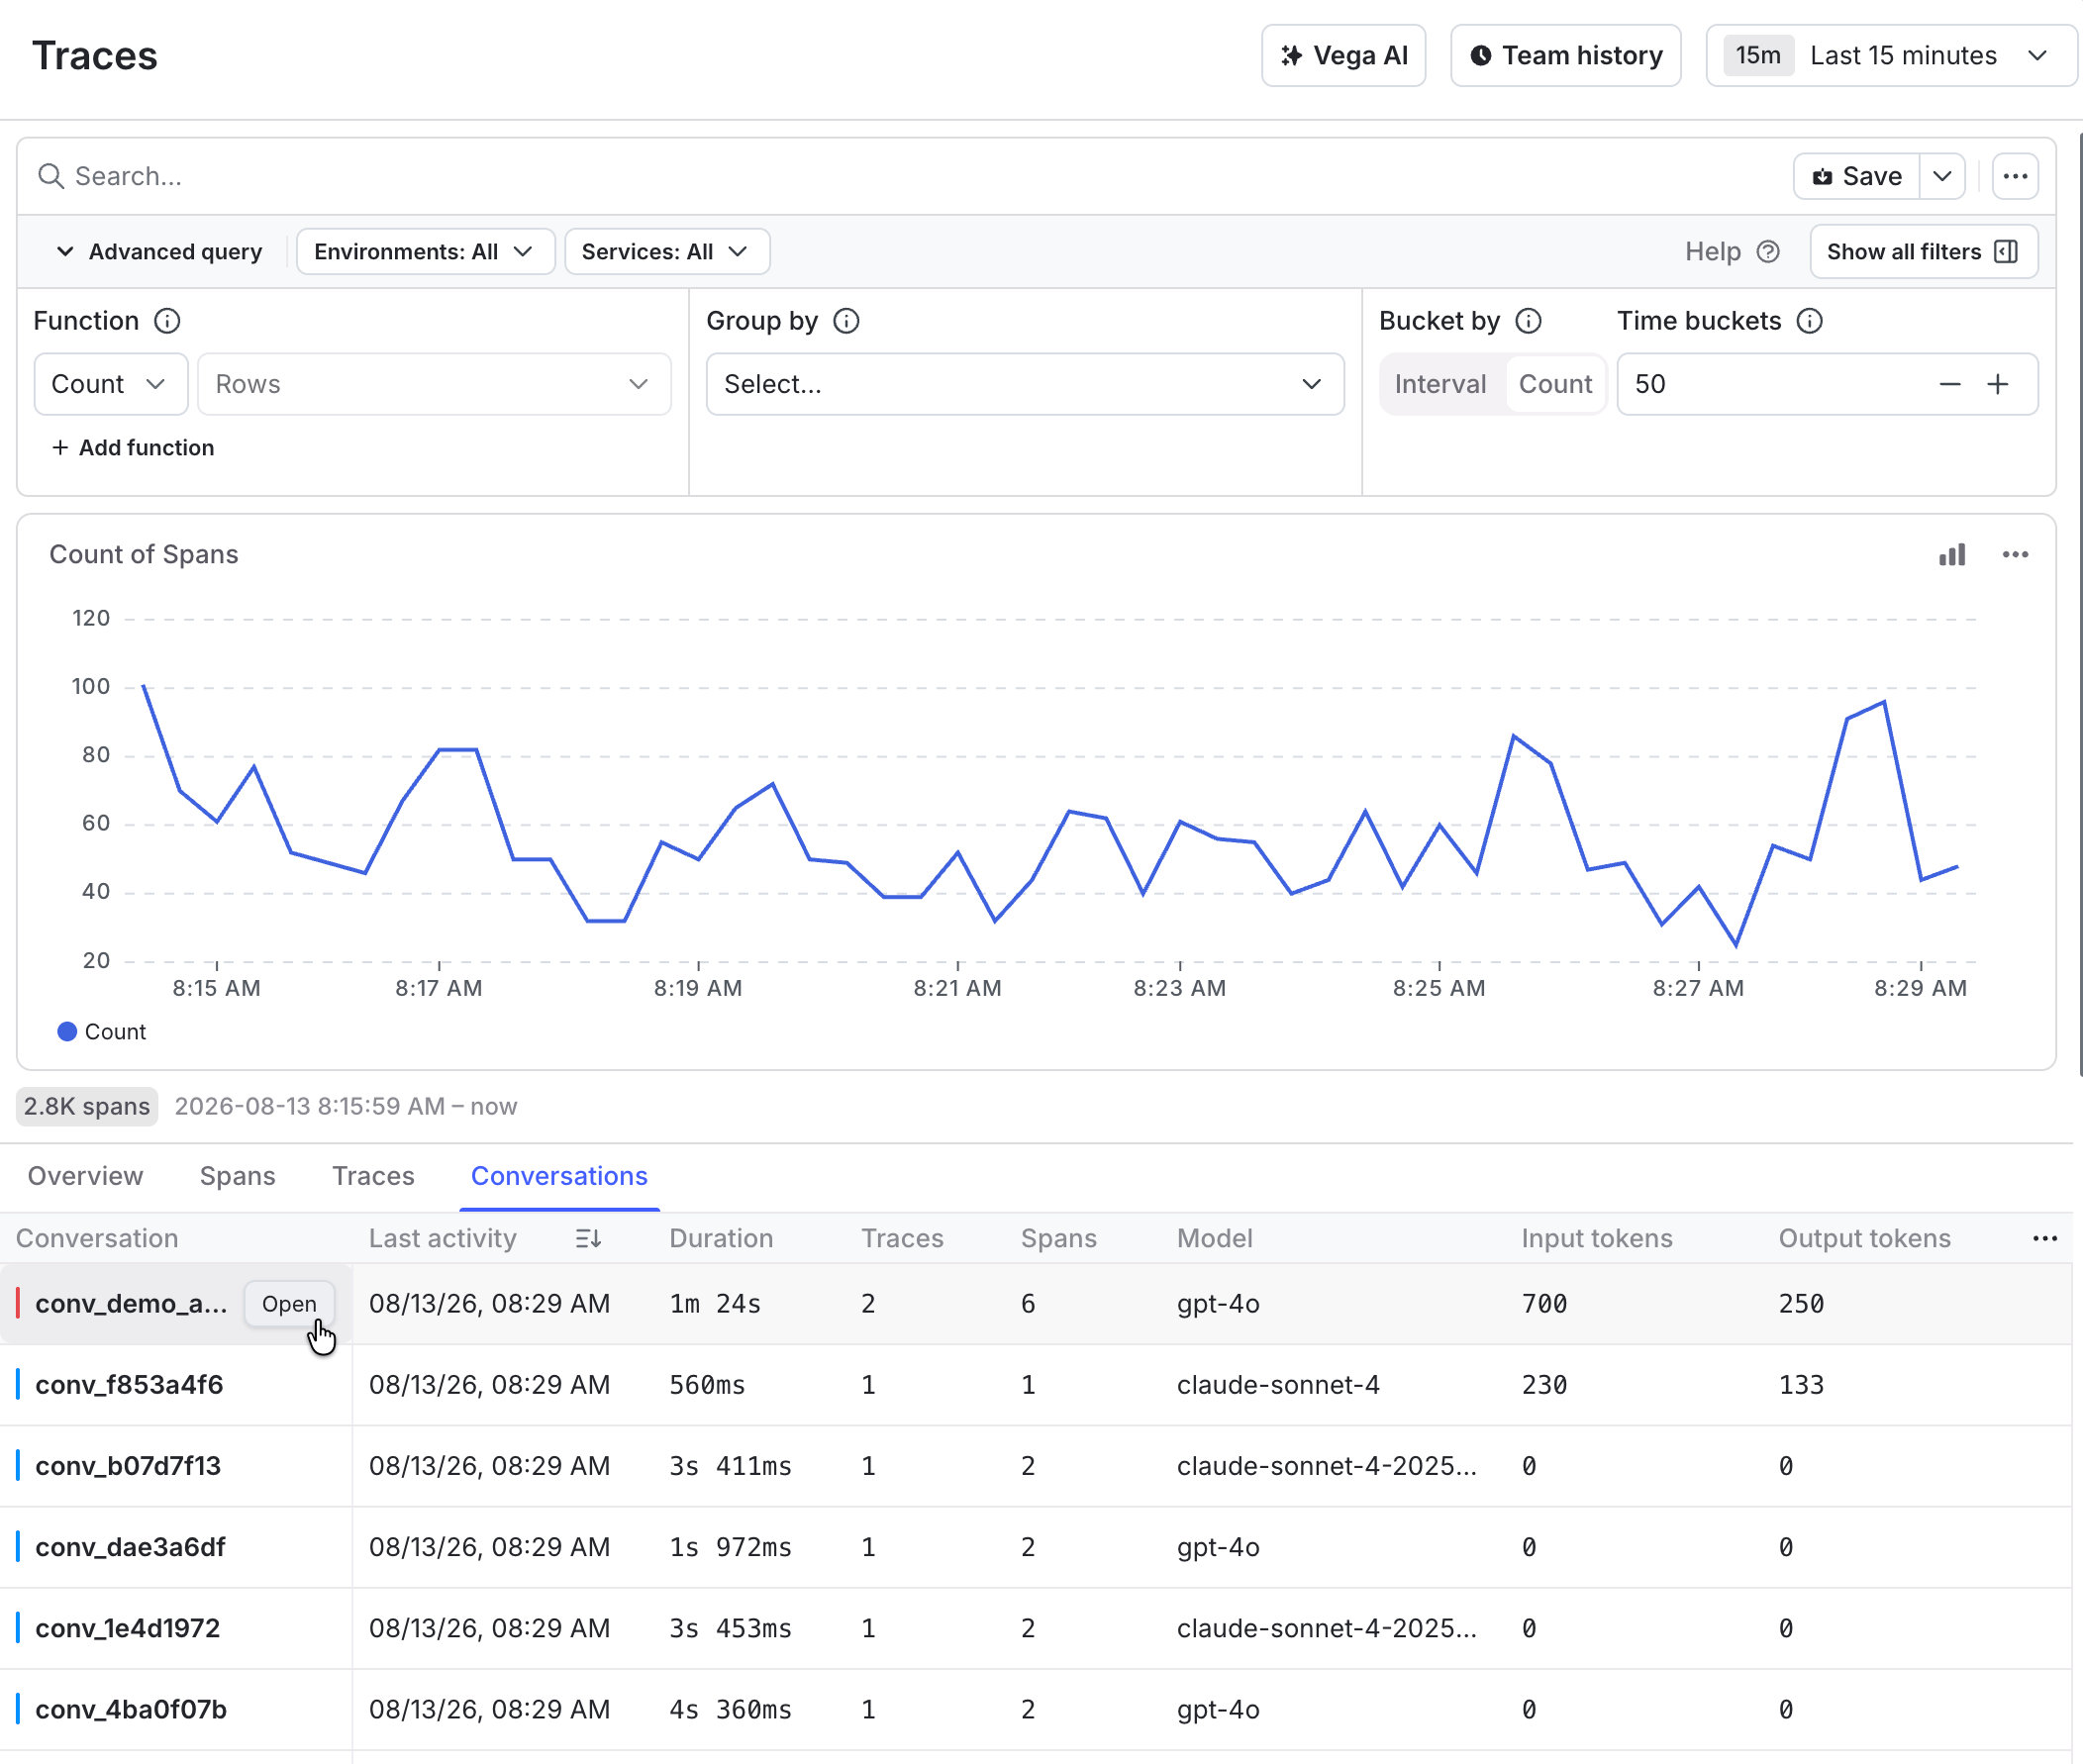 The list displays one row per conversation, with the following columns:
| Column | Description |
|---|---|
| Conversation | The conversation ID your application set. |
| Last activity | When the most recent span in the conversation started. |
| Duration | Elapsed time from the first span to the end of the last span. |
| Traces | How many distinct traces the conversation spans. |
| Spans | Total spans carrying the conversation ID. |
| Model | Every distinct model used in the conversation. |
| Provider | Every distinct provider used in the conversation. |
| Input tokens, Output tokens | Token counts summed across the conversation. |
| Errors | How many spans reported an error status. |
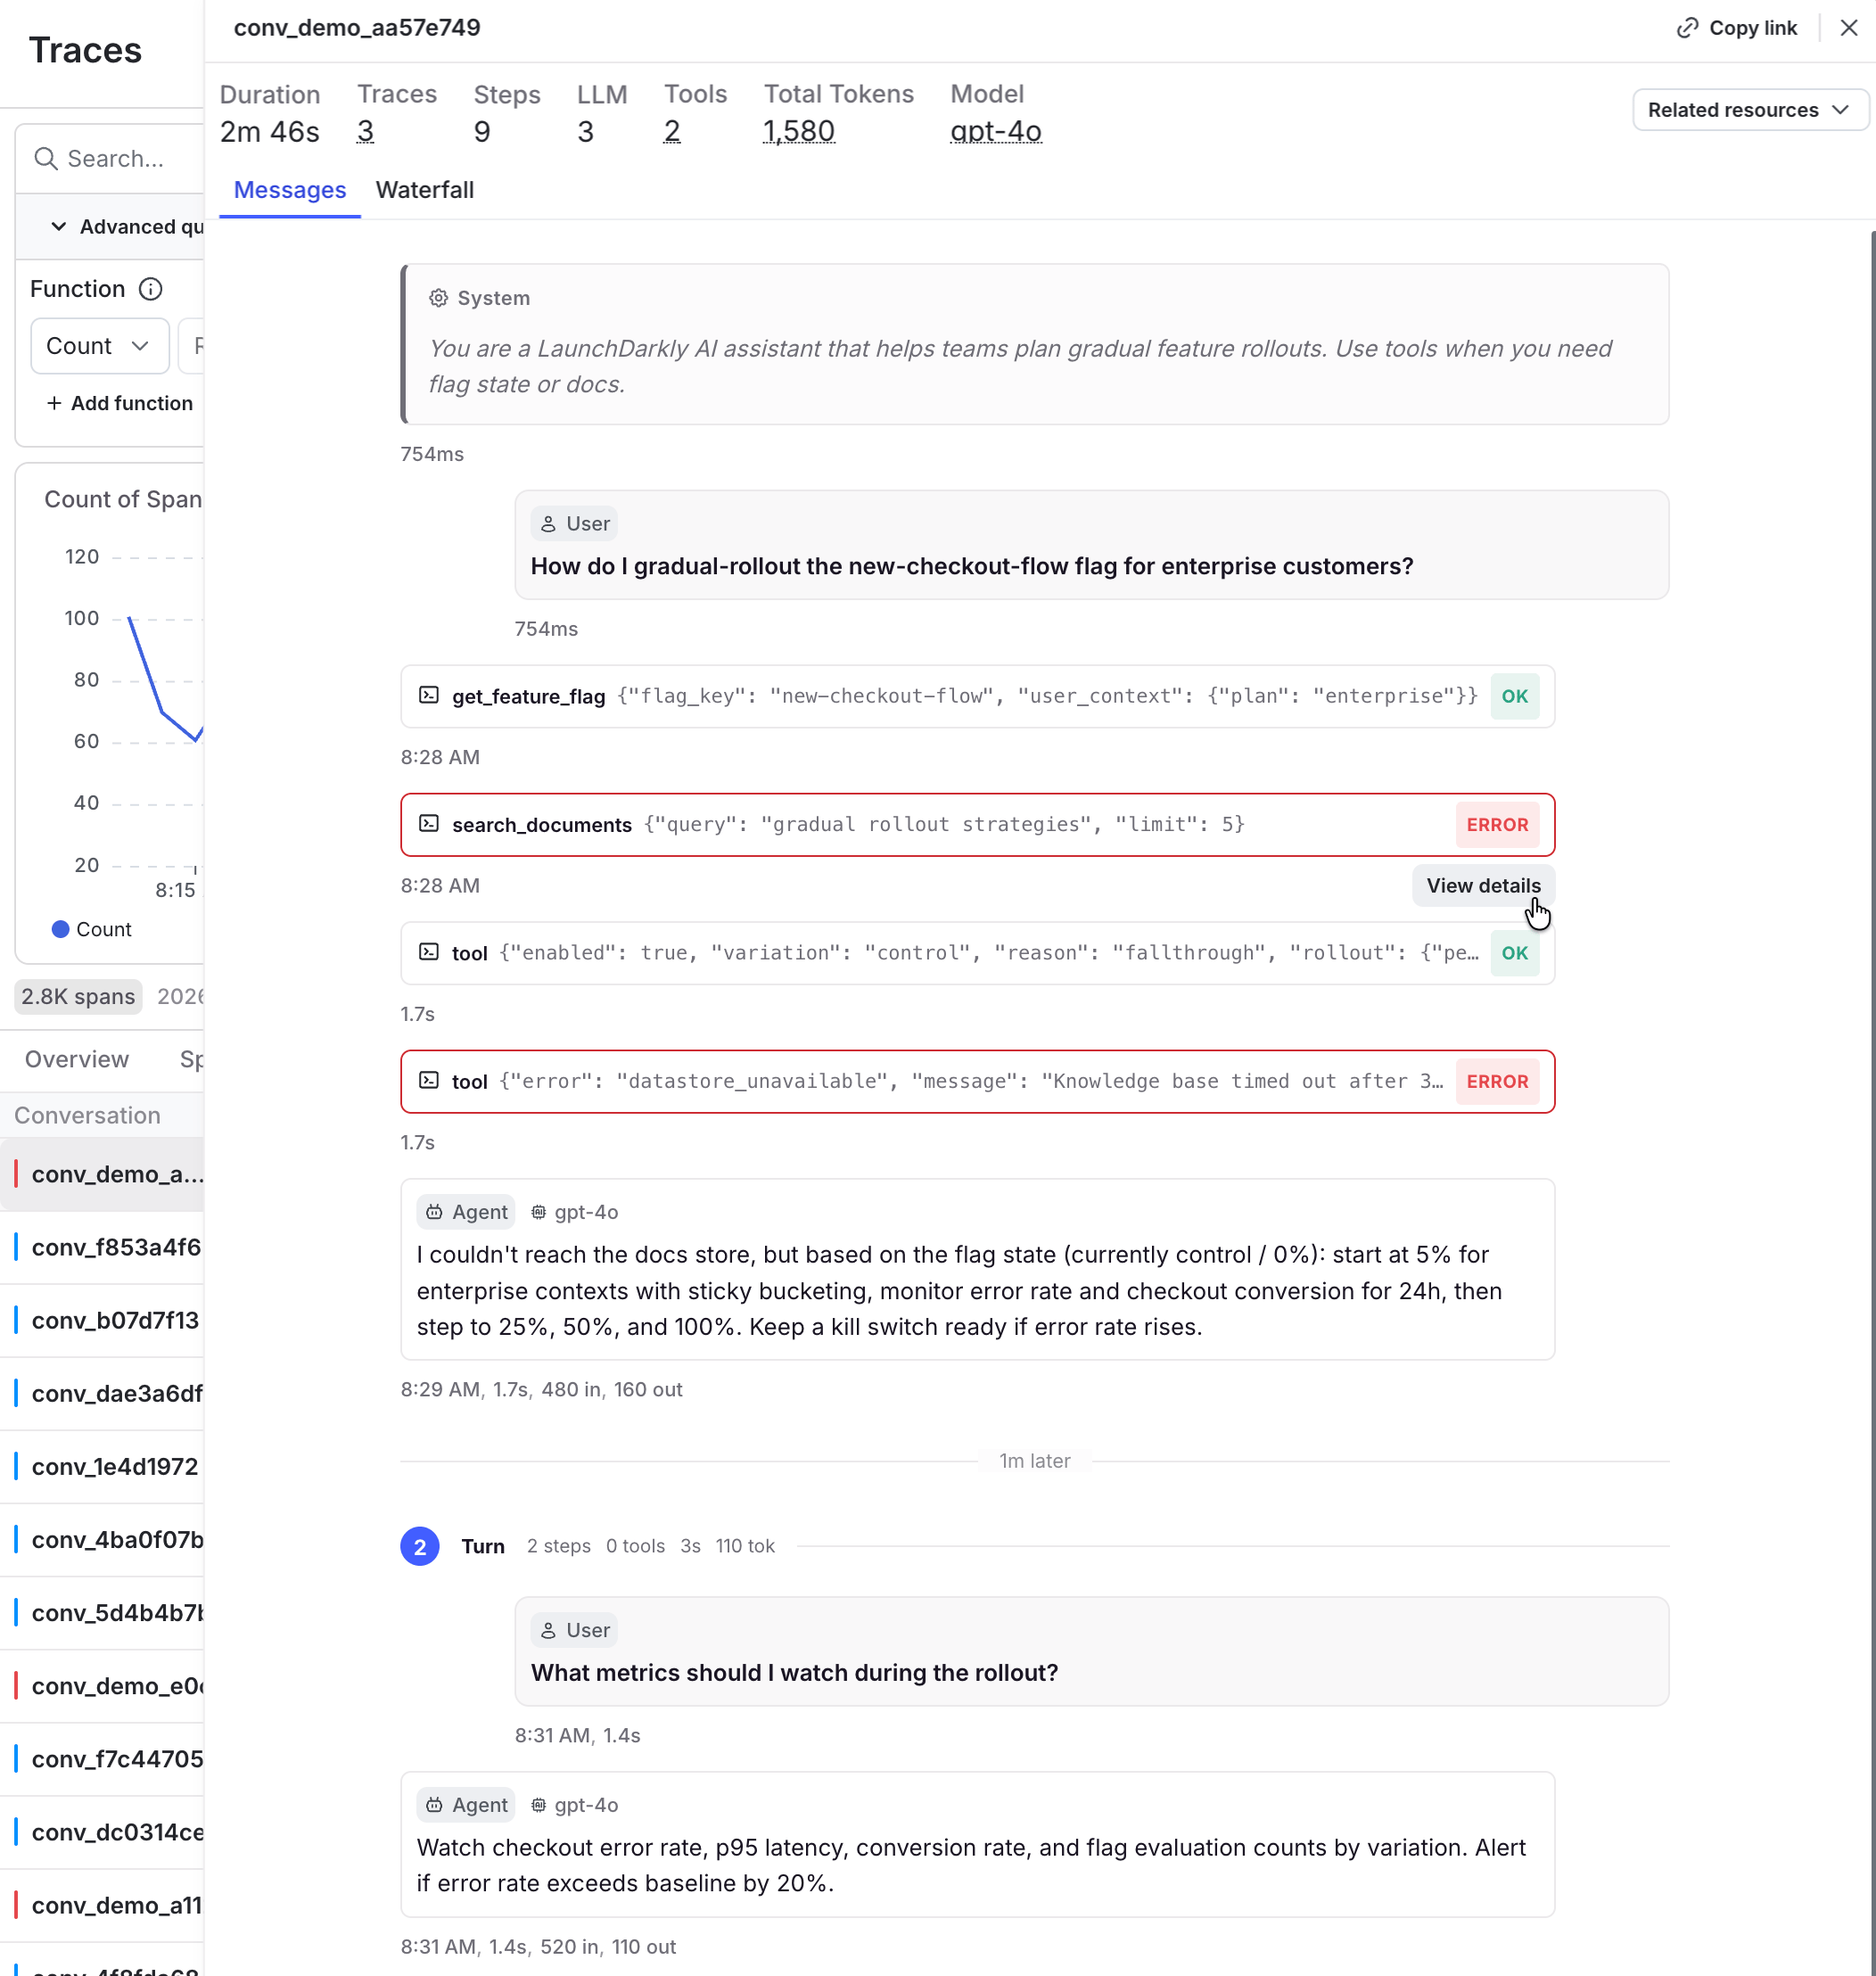 Click the span icon on a turn to display raw data for the turn in a span details drawer.
Each turn displays the metadata available for it, which may include the model, token counts, latency, cost, and any evaluation scores. Tool calls display the tool name with a summary of the arguments and result, and expand to the full payload.
Turns whose timing LaunchDarkly could not determine do not display a time offset. This happens when a message is recovered from a later snapshot of the conversation history rather than observed directly. To learn more, read [Emit message content](/docs/sdk/features/observability-llm-instrumentation#emit-message-content).
### Read the summary
The conversation header summarizes the whole thread:
Click the span icon on a turn to display raw data for the turn in a span details drawer.
Each turn displays the metadata available for it, which may include the model, token counts, latency, cost, and any evaluation scores. Tool calls display the tool name with a summary of the arguments and result, and expand to the full payload.
Turns whose timing LaunchDarkly could not determine do not display a time offset. This happens when a message is recovered from a later snapshot of the conversation history rather than observed directly. To learn more, read [Emit message content](/docs/sdk/features/observability-llm-instrumentation#emit-message-content).
### Read the summary
The conversation header summarizes the whole thread:
| Metric | How LaunchDarkly calculates it |
|---|---|
| Duration | Elapsed time from the earliest span to the end of the latest span. |
| Traces | Distinct traces. Hover to read the per-trace breakdown. |
| Steps | Number of turns in the transcript, after LaunchDarkly removes duplicate observations of the same message. |
| LLM | Spans identified as model calls or agent invocations. |
| Tools | Tool execution spans. Hover to read the per-tool breakdown. |
| Total tokens | Input, output, cache read, and cache write tokens combined. Hover to read the breakdown of tokens. |
| Models | Distinct models. Hover to read the per-model call count. |
| Estimated cost | Token counts priced using your configured model costs, or the cost the emitter reported on the span. When some model calls cannot be priced, the value ends with a plus sign. Hover to read the cost per model and which models are not priced. |
| What you observe | Likely cause |
|---|---|
| The conversation does not appear in the list | `gen_ai.conversation.id` is missing, or set under a different key. It must be on every span in the conversation. |
| The conversation appears, but the transcript is empty | No span carries `gen_ai.input.messages`, `gen_ai.output.messages`, or `gen_ai.system_instructions`. |
| A tool renders before the message that requested it | The model call's output has no matching `tool_call` part. To learn more, read [Structure tool calls](/docs/sdk/features/observability-llm-instrumentation#structure-tool-calls). |
| Every turn appears at the start of the conversation | `tool_call` parts are on the envelope span rather than the per-call spans. |
| The transcript opens with the agent replying to nothing | The opening question was never recorded. To learn more, read [Capture the opening question](/docs/sdk/features/observability-llm-instrumentation#capture-the-opening-question). |
| The person's question appears as agent output | Message text is accumulated in a shared buffer rather than keyed per message. |
| Tokens appear in the conversation but the list displays zero | Token usage uses the older `prompt_tokens` and `completion_tokens` names. |
| Estimated cost is blank or ends with a plus sign | Cost is blank when no model call in the conversation can be priced. A plus sign means the value is the total for the calls that can be priced, and some calls cannot be. Hover to read which models are not priced. A call cannot be priced when it is missing a model, a provider, or a token count, or when its model has no configured token cost. Token costs are set on [AI model configurations](/docs/home/agentcontrol/create-model-config). LaunchDarkly uses those costs to price any instrumented model call, including calls that are not part of a config. |
| Turns display no timing | Those messages were recovered from a later history snapshot rather than observed directly. Emit message deltas to improve this. |
| Evaluation badges do not appear | Evaluation events are attached to a separate evaluation span rather than to the span being scored. |
| The LLM Agent default dashboard reports less activity than expected | Inference spans carry HTTP or database attributes and are classified by those instead. To learn more, read [Avoid a common misclassification](/docs/sdk/features/observability-llm-instrumentation#avoid-a-common-misclassification). |
| A failed run appears as an empty conversation | The run failed before its first model call, so the error is recorded on a span that contributes no turns. The error is visible on the span itself. |