| Feature flag |
`feature_flag` |
Specifies whether the session is associated with a feature flag. You can refine results with the following additional attributes: `context.id`, `contextKeys`, `key`, `provider.name`, `result.reason.inExperiment`, `result.reason.kind`, `result.value`, and `set.id`. |
`true` |
| Log properties |
`code.filepath` |
File path emitting the log. |
`/build/backend/worker/worker.go` |
|
`code.function` |
Function emitting the log. |
`github.com/acme-org/acme/backend/worker.(*Worker).Start.func3` |
|
`code.lineno` |
Line number of the file where the log was emitted. |
`20` |
|
`level` |
The log level. |
`info` |
|
`message` |
The log message. |
`public-graph graphql request failed` |
|
`span_id` |
Span ID that contains this log. |
`528a54addf6f91cc` |
|
`trace_id` |
Trace ID that contains this log. |
`7654ff38c4631d5a51b26f7e637eea3c` |
| Service and application |
`environment` |
The environment key, based on the SDK credentials used in the [observability SDKs](/docs/sdk/observability). |
`production` |
|
`host.name` |
The hostname. |
`ip-172-31-5-211.us-east-2.compute.internal` |
|
`os.description` |
Description of the operating system. |
`Alpine Linux 3.17.2 (Linux ip-172-31-5-211.us-east-2.compute.internal 5.10.167-147.601.amzn2.aarch64 #1 SMP Tue Feb 14 21:50:23 UTC 2023 arch64)` |
|
`os.type` |
Type of operating system. |
`linux` |
|
`secure_session_id` |
Session ID that contains the log. |
`wh1jcuN5F9G6Ra5CKeCjdIk6Rbyd` |
|
`service_name` |
Name of the service specified in the SDK plugin. To learn more, read [Versioning sessions and errors](/docs/sdk/features/observability-config-client-side#versioning-sessions-and-errors). |
`private-graph` |
|
`service_version` |
Version of the service specified in the observability SDK plugin. To learn more, read [Versioning sessions and errors](/docs/sdk/features/observability-config-client-side#versioning-sessions-and-errors). |
`e1845285cb360410aee05c61dd0cc57f85afe6da` |
|
`source` |
General origin of the log. |
`backend` |
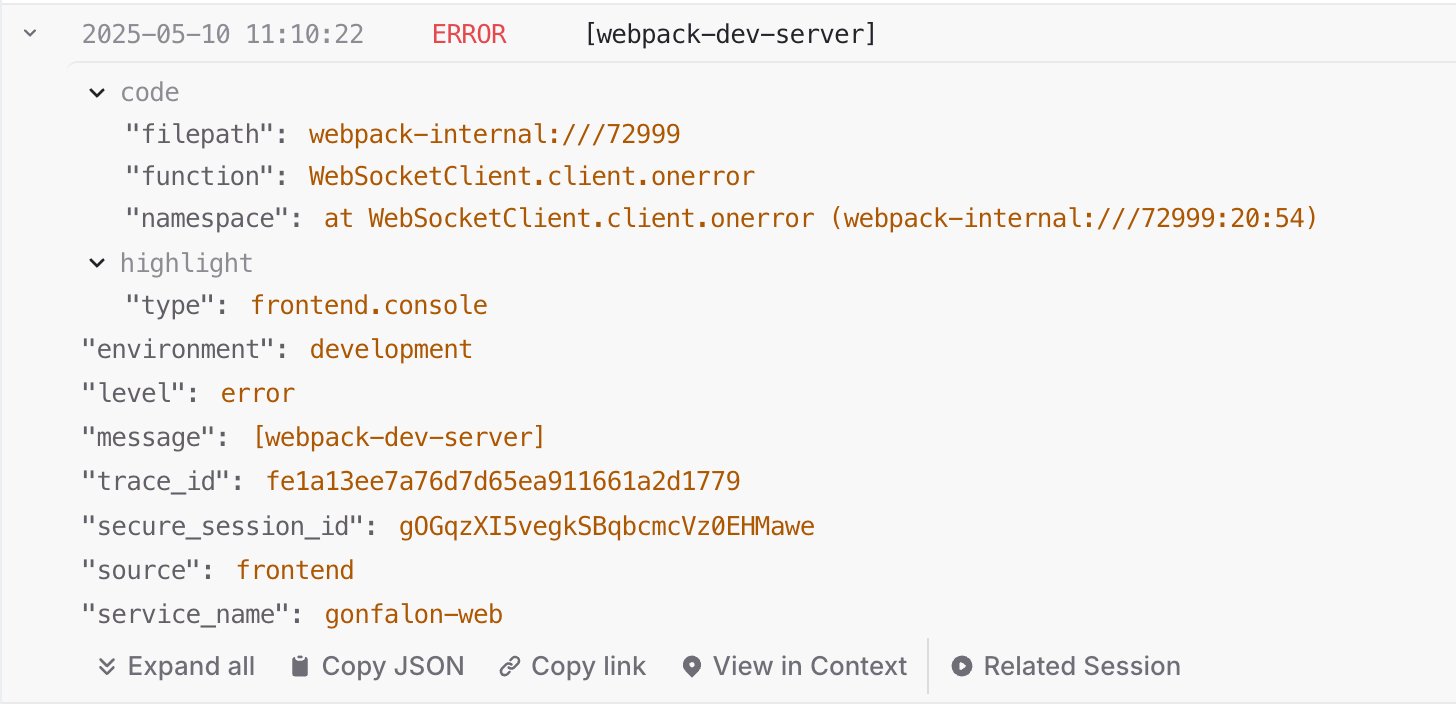
 Click any log entry to see more details about the event, such as the session ID, the source of the event, and more. Click **Related session** to see the session replay for the log entry.
 ## Get started
To instrument your application to capture logs, read the documentation on [Observability SDKs](/docs/sdk/observability). The functionality is available through plugins to the LaunchDarkly JavaScript SDK.
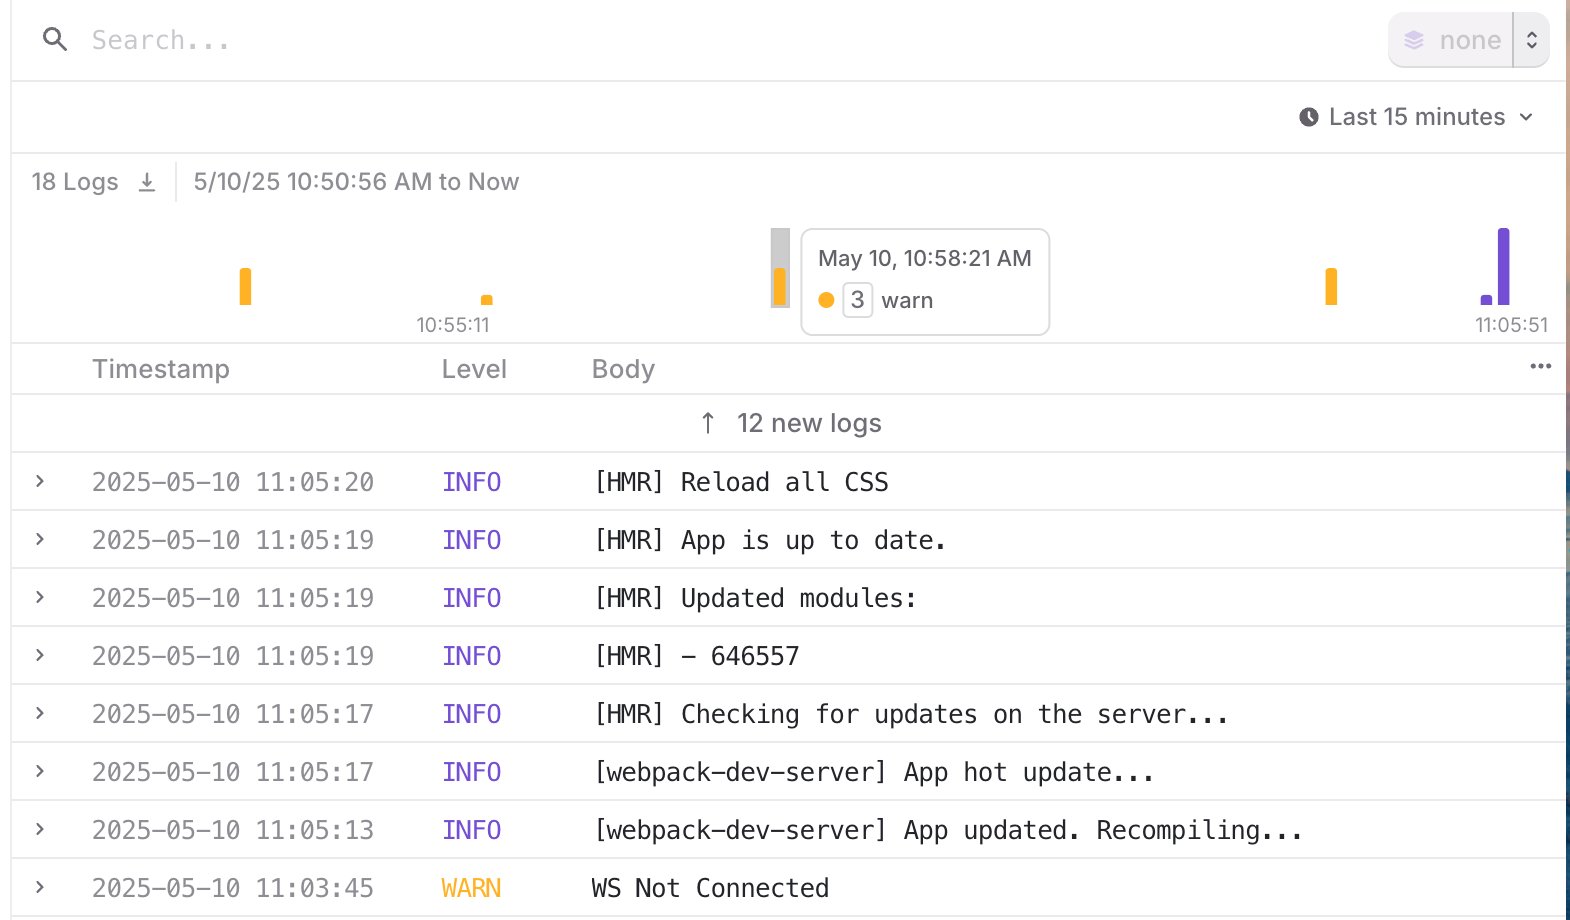
To view logs for your application, open the **Telemetry** section and navigate to the **Logs** list.
## Search
To learn more about the search specification for the logs view, read [Search specification](/docs/home/observability/search).
### Search attributes
By default, the observability SDK plugin automatically injects the following attributes to provide additional help with searching for logs:
## Get started
To instrument your application to capture logs, read the documentation on [Observability SDKs](/docs/sdk/observability). The functionality is available through plugins to the LaunchDarkly JavaScript SDK.
To view logs for your application, open the **Telemetry** section and navigate to the **Logs** list.
## Search
To learn more about the search specification for the logs view, read [Search specification](/docs/home/observability/search).
### Search attributes
By default, the observability SDK plugin automatically injects the following attributes to provide additional help with searching for logs: