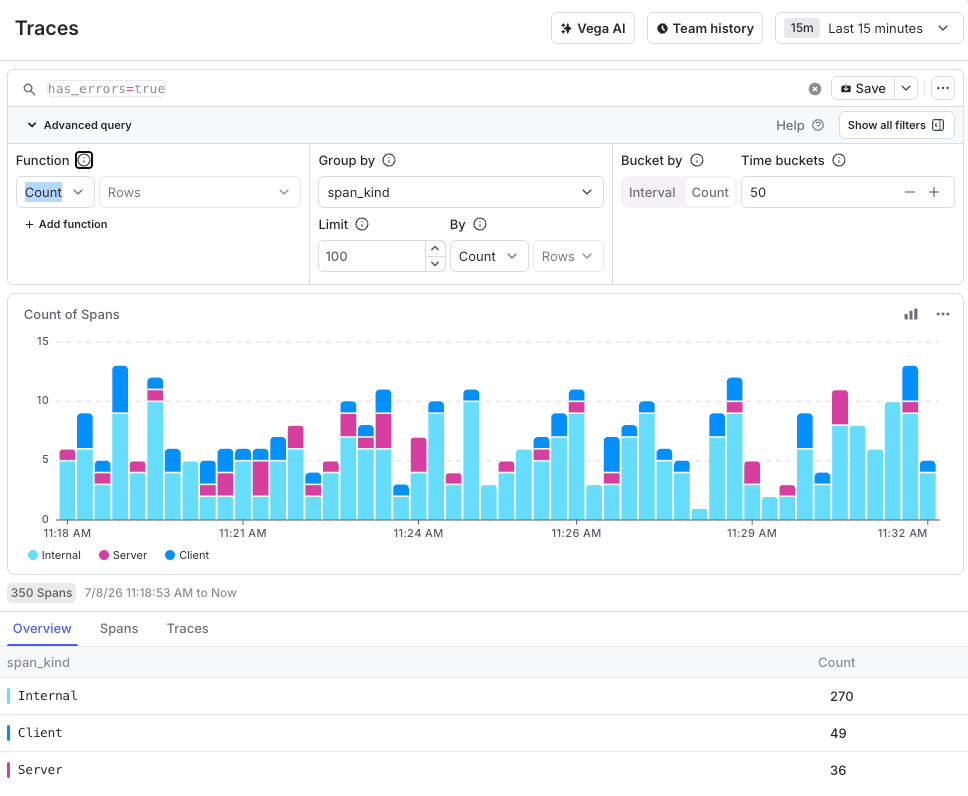
 Select tabs at the bottom of the **Traces** page to display raw data for the results of your query:
* **Overview** shows the grouped aggregation values associated with the chart display.
* **Spans** shows one row for each span in your query result.
* **Traces** shows one row for each trace that contains spans from your query result.
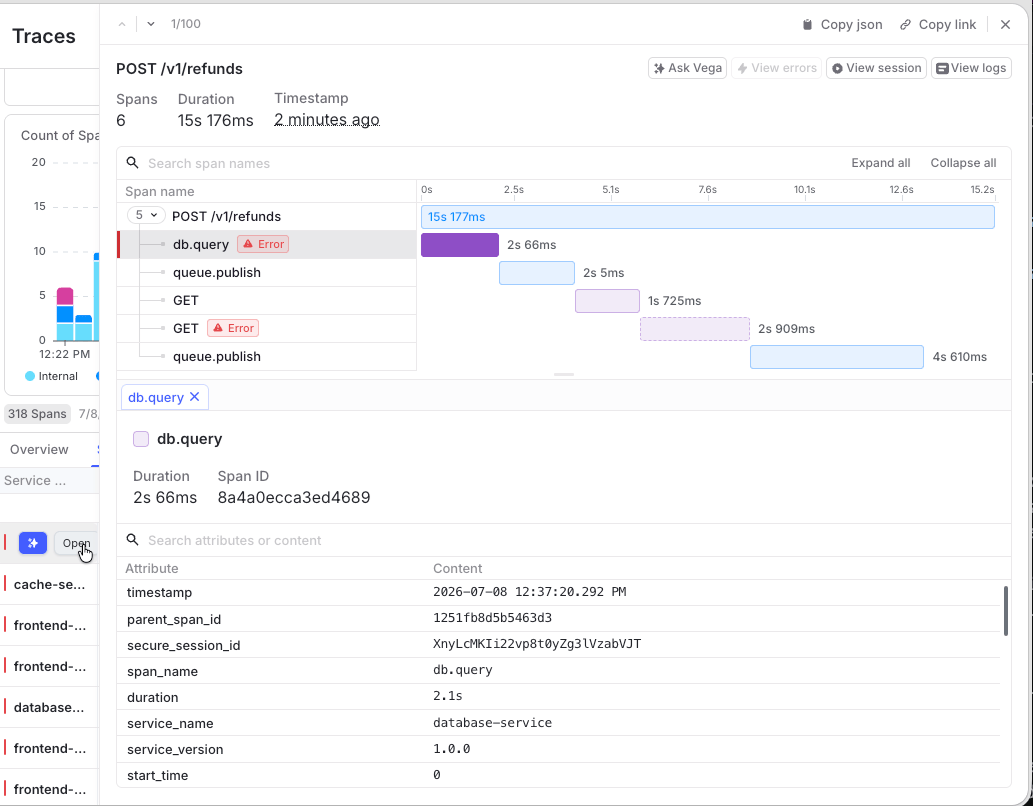
In the **Spans** or **Traces** tab, hover over an entry in the first column to view options for displaying details about the selected row. Select **Open** to view full trace details associated with the span or trace, or select the **Vega** icon to add the span or trace to a Vega prompt.
You can also open a service's details panel from either tab. In the **Spans** tab, click a service name in the "Service Name" column. In the **Traces** tab, click a service name in the "Root service" column. To learn more, read [Service details](/docs/home/observability/service-details).
Select tabs at the bottom of the **Traces** page to display raw data for the results of your query:
* **Overview** shows the grouped aggregation values associated with the chart display.
* **Spans** shows one row for each span in your query result.
* **Traces** shows one row for each trace that contains spans from your query result.
In the **Spans** or **Traces** tab, hover over an entry in the first column to view options for displaying details about the selected row. Select **Open** to view full trace details associated with the span or trace, or select the **Vega** icon to add the span or trace to a Vega prompt.
You can also open a service's details panel from either tab. In the **Spans** tab, click a service name in the "Service Name" column. In the **Traces** tab, click a service name in the "Root service" column. To learn more, read [Service details](/docs/home/observability/service-details).
 ## Get started
To instrument your application to capture traces, read the documentation on [Observability SDKs](/docs/sdk/observability). The functionality is available through plugins to the LaunchDarkly JavaScript SDK.
To ingest OpenTelemetry traces from other source, read [Observability integrations](/docs/home/observability/integrations) and configure your application to use the LaunchDarkly observability endpoints.
To view available traces, open the **Telemetry** section and navigate to the **Traces** list.
## Search
To learn more about the search specification for the **Traces** view, read [Search specification](/docs/home/observability/search).
When you search on the **Traces** view, the following behaviors apply by default:
* The default search [key](/docs/home/observability/search#keys-and-values) is `span_name`. For example, if you enter an expression without a key, such as `search-term`, then LaunchDarkly automatically expands that to `span_name=*search-term*`.
### Search attributes
By default, the [observability SDK plugin](/docs/sdk/observability) automatically injects the following attributes to provide additional help with searching for traces:
## Get started
To instrument your application to capture traces, read the documentation on [Observability SDKs](/docs/sdk/observability). The functionality is available through plugins to the LaunchDarkly JavaScript SDK.
To ingest OpenTelemetry traces from other source, read [Observability integrations](/docs/home/observability/integrations) and configure your application to use the LaunchDarkly observability endpoints.
To view available traces, open the **Telemetry** section and navigate to the **Traces** list.
## Search
To learn more about the search specification for the **Traces** view, read [Search specification](/docs/home/observability/search).
When you search on the **Traces** view, the following behaviors apply by default:
* The default search [key](/docs/home/observability/search#keys-and-values) is `span_name`. For example, if you enter an expression without a key, such as `search-term`, then LaunchDarkly automatically expands that to `span_name=*search-term*`.
### Search attributes
By default, the [observability SDK plugin](/docs/sdk/observability) automatically injects the following attributes to provide additional help with searching for traces:
| Category | Attribute | Description | Example |
|---|---|---|---|
| Feature flag | `feature_flag` | Produces a list of spans that are associated with a feature flag. You can refine results with the following additional attributes: `context.id`, `contextKeys`, `key`, `provider.name`, `result.reason.inExperiment`, `result.reason.kind`, `result.value`, `set.id`, and `.variant`. | `true` |
| Service or application | `environment` | The environment key, based on the SDK credentials used in the [Observability SDKs](/docs/sdk/observability). | `production` |
| `secure_session_id` | Session ID that contains the span. | `wh1jcuN5F9G6Ra5CKeCjdIk6Rbyd` | |
| `service_name` | Name of the service specified in the SDK plugin. To learn more, read [Versioning sessions and errors](/docs/sdk/features/observability-config-client-side#versioning-sessions-and-errors). | `private-graph` | |
| `service_version` | Version of the service specified in the observability SDK plugin. To learn more, read [Versioning sessions and errors](/docs/sdk/features/observability-config-client-side#versioning-sessions-and-errors). | `e1845285cb360410aee05c61dd0cc57f85afe6da` | |
| Trace properties | `duration` | Time length of the span. Defaults to nanoseconds. Use `s`, `m`, or `h` suffixes to designate seconds, minutes, or hours. | `10s` |
| `has_errors` | Whether the span has an error tied to its ID. | `true` | |
| `parent_span_id` | Span ID of the span's parent. | `327611203ec5b0a1` | |
| `span_kind` | Broad source of the span. | `Browser` | |
| `span_name` | Title of the span. | `POST https://app.launchdarkly.com` | |
| `trace_id` | Trace ID of the spans. | `7654ff38c4631d5a51b26f7e637eea3c` |