> ## Documentation Index
> Fetch the complete documentation index at: https://launchdarkly.com/docs/llms.txt
> Use this file to discover all available pages before exploring further.
# Troubleshoot guarded rollout errors
**This feature is not available in federal environments**
To learn more, read LaunchDarkly in federal environments.
**This feature is not available in LaunchDarkly's European Union (EU) instance**
To learn more, read LaunchDarkly in the European Union (EU).
**Guarded rollouts are available to customers on select plans**
Guarded rollouts are available to customers on an Enterprise plan with the Guardian add-on. To learn more, [read about our pricing](https://launchdarkly.com/pricing/) or [contact Sales](https://launchdarkly.com/contact-sales/).
All LaunchDarkly accounts include a limited trial of guarded rollouts. Use this to evaluate the feature in real-world releases.
This topic explains how to investigate and debug certain user-facing errors in your guarded rollouts.
When you start a guarded rollout, LaunchDarkly compares the performance of the new variation to the original variation. A regression occurs when sequential testing determines that the absolute difference between the variations represents a statistically significant negative impact on a monitored metric.
If your rollout monitors user-facing error metrics, you can use LaunchDarkly debugging tools to investigate and mitigate the source of errors that contribute to a regression.
## Metric availability
The debugging feature is available only for [autogenerated metrics](/docs/home/metrics/autogen/observability) with the event key `$ld:telemetry:error`. LaunchDarkly automatically creates this metric, typically named "User error rate (LaunchDarkly)," although the name may differ depending on your account setup.
This autogenerated metric is available through LaunchDarkly observability SDKs. You can enable observability when you initialize the LaunchDarkly client in your app. To learn how, read about LaunchDarkly's [observability SDKs](/docs/sdk/observability).
After you configure the SDK, add the "User error rate (LaunchDarkly)" metric to your guarded rollout when you [create the rollout](/docs/home/releases/creating-guarded-rollouts) to use the debugging feature.
## View regressions
If a guarded rollout identifies a regression, use the **Targeting** or **Monitoring** tabs to review the affected metric and investigate related errors.
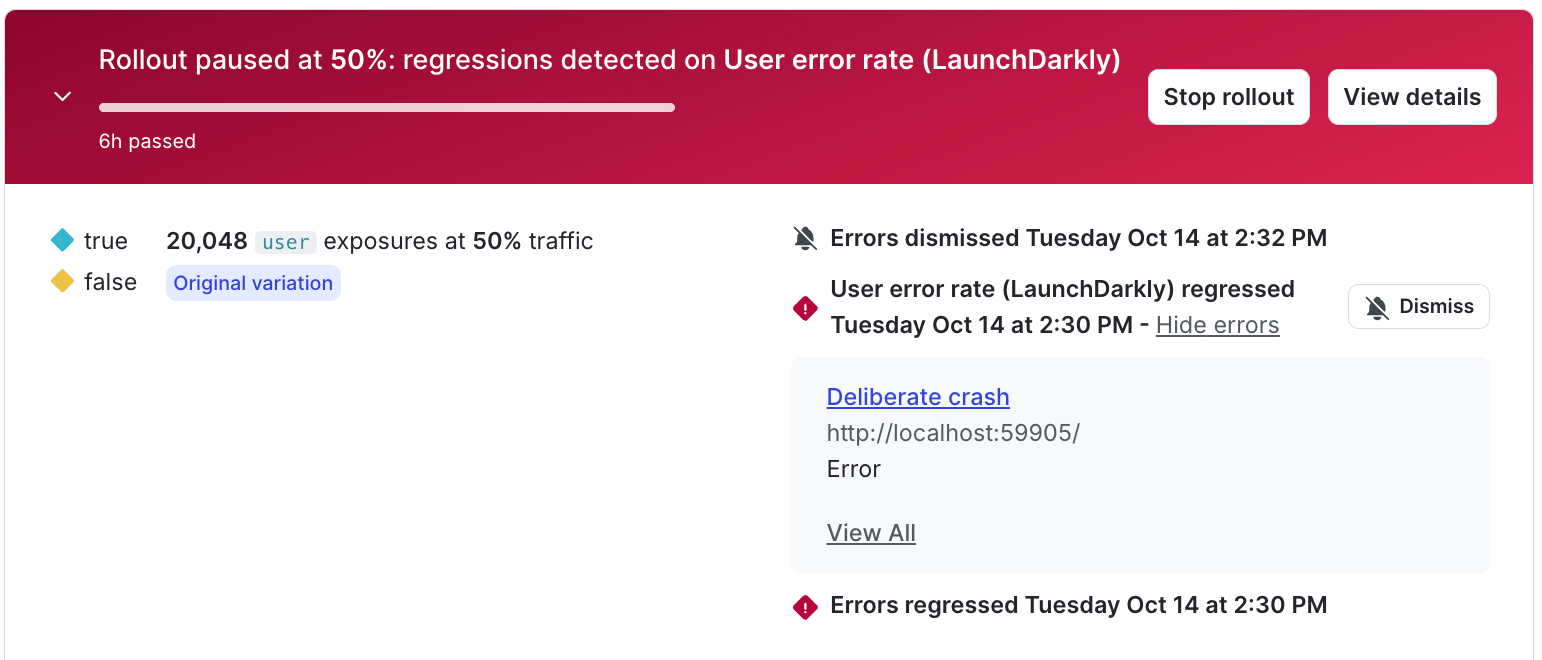 1. Navigate to your flag or AgentControl config and open the **Targeting** or **Monitoring** tab.
2. Locate the metric tile for "User error rate (LaunchDarkly)". If LaunchDarkly identifies a regression, a "User error rate (LaunchDarkly) regressed" message appears.
3. Click **Show errors** to expand the list of detected errors.
4. Click the error name to navigate to the related error group.
To learn more about investigating error groups, read [View errors](/docs/home/observability/errors#view-errors).
1. Navigate to your flag or AgentControl config and open the **Targeting** or **Monitoring** tab.
2. Locate the metric tile for "User error rate (LaunchDarkly)". If LaunchDarkly identifies a regression, a "User error rate (LaunchDarkly) regressed" message appears.
3. Click **Show errors** to expand the list of detected errors.
4. Click the error name to navigate to the related error group.
To learn more about investigating error groups, read [View errors](/docs/home/observability/errors#view-errors).