> ## Documentation Index
> Fetch the complete documentation index at: https://launchdarkly.com/docs/llms.txt
> Use this file to discover all available pages before exploring further.
# Splunk
**The Splunk integration is available to customers on select plans**
The Splunk integration is only available to customers on select plans. To learn more, [read about our pricing](https://launchdarkly.com/pricing/). To upgrade your plan, [contact Sales](https://launchdarkly.com/contact-sales/).
This topic explains how to use the LaunchDarkly [Splunk](https://www.splunk.com/) integration. The Splunk integration exports LaunchDarkly audit events when a LaunchDarkly resource you care about, such as feature flags, projects, or account members, changes. You can use these events to create reports, charts, alerts and dashboards in Splunk.
**This integration is for Splunk Enterprise and Splunk Cloud (self-service and managed)**
Based on which type of Splunk account you have, endpoint hostnames, ports, and paths may differ from what's depicted in this topic. We indicate these differences when they occur in the text below.
## Prerequisites
To configure the integration, you must have the following prerequisites:
* A Splunk HTTP Event Collector (HEC). To learn more, read [Set up an HTTP Event Collector in Splunk Web](#set-up-an-http-event-collector-in-splunk-web)
* An HEC token, which is generated during HEC setup.
## Set up an HTTP Event Collector in Splunk Web
To add LaunchDarkly events to Splunk, you must configure and enable Splunk's HTTP Event Collector (HEC) in Splunk Web.
The steps to enable HEC vary based on your Splunk instance. To enable HEC, read [Splunk's documentation](https://docs.splunk.com/Documentation/Splunk/latest/Data/UsetheHTTPEventCollector).
## Configure LaunchDarkly to work with Splunk
To configure LaunchDarkly to start sending events to Splunk:
1. Click the **gear** icon in the left sidebar to view Organization settings.
2. Click **Integrations** and find "Splunk."
3. Click **Add integration**. The "Create Splunk configuration" panel appears.
4. (Optional) Give the integration a human-readable **Name**.
5. Paste the HTTP event collector URL into the **HTTP event collector base URL**. This URL varies based on which version of Splunk you have. To learn more about which URL format to use, read [Splunk's documentation](https://docs.splunk.com/Documentation/Splunk/latest/Data/UsetheHTTPEventCollector#Send_data_to_HTTP_Event_Collector).
6. Paste your HEC token in the **Token** field.
7. If you're using Splunk Cloud, you will probably need to check the **Skip certificate verification** checkbox. Splunk Cloud instances are deployed with self-signed SSL certificates which prevents LaunchDarkly's integration service from reaching Splunk Cloud's HEC service.
8. (Optional) Configure a custom policy to control which event information LaunchDarkly sends to Splunk. To learn more about this option, read [Add policies to the Splunk integration](#add-policies-to-the-splunk-integration).
9. After reading the Integration Terms and Conditions, check the **I have read and agree to the Integration Terms and Conditions** checkbox.
10. Click **Save configuration**.
Splunk now receives events from LaunchDarkly.
To further modify the events that Splunk receives from LaunchDarkly, add custom policies to determine which events the integration should export. If after following these steps, you still are not able to locate LaunchDarkly events, read the [Troubleshooting](#troubleshooting) section for further guidance.
### Add policies to the Splunk integration
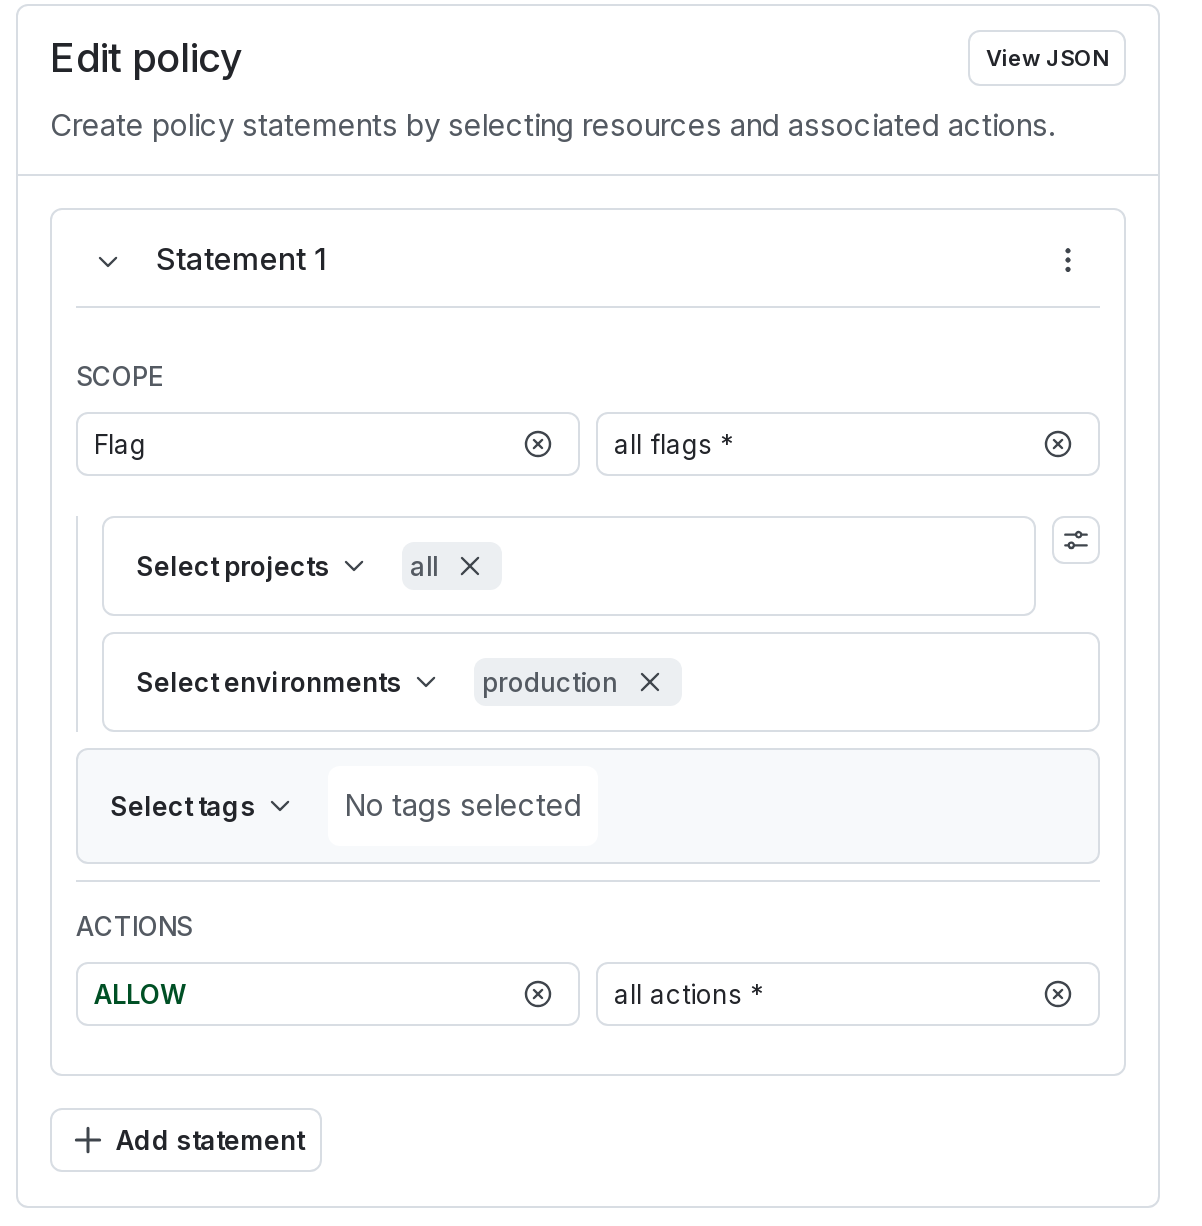
By default, the Splunk integration sends production flag change events to Splunk. You can customize those events with the policy editor, using the same language and construction as when you create policy statements for a role.
To learn more, read [Roles](/docs/home/account/roles).
You can customize the events LaunchDarkly sends to Splunk by using the policy editor in the Splunk configuration panel:
 ## Access LaunchDarkly events in Splunk
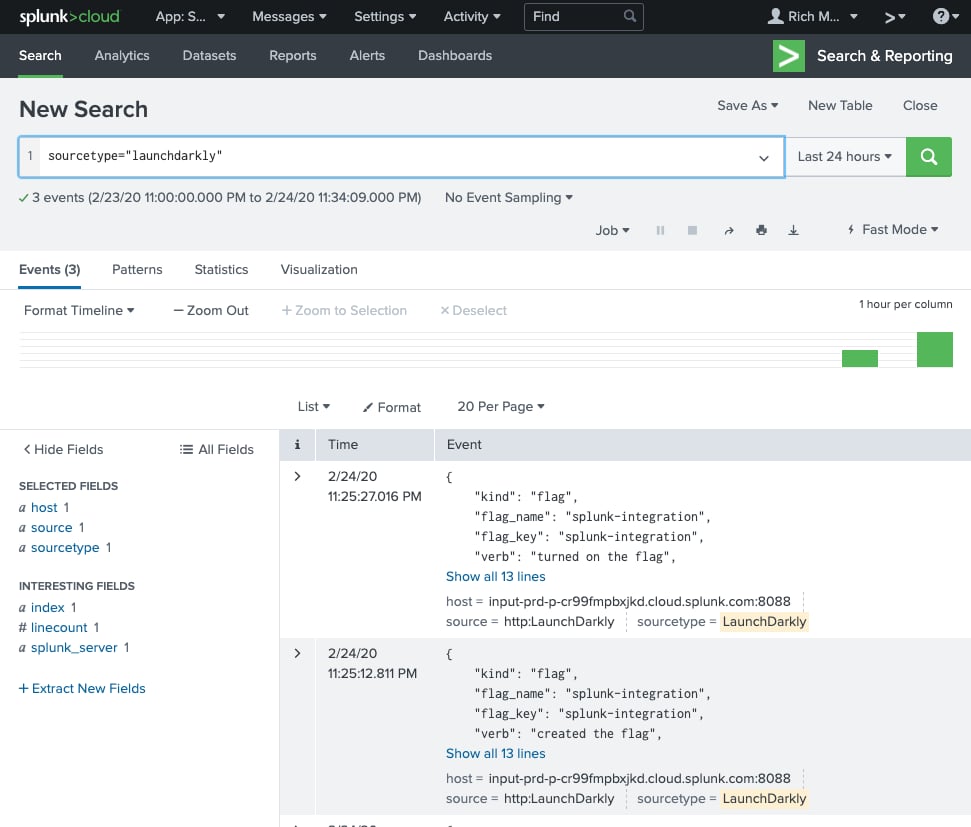
Now that your integration is configured, you can view LaunchDarkly events in Splunk.
Access those events with the following Splunk search query:
```sql title="Splunk Query Language" lines wrap theme={null}
sourcetype=""
```
## Access LaunchDarkly events in Splunk
Now that your integration is configured, you can view LaunchDarkly events in Splunk.
Access those events with the following Splunk search query:
```sql title="Splunk Query Language" lines wrap theme={null}
sourcetype=""
```
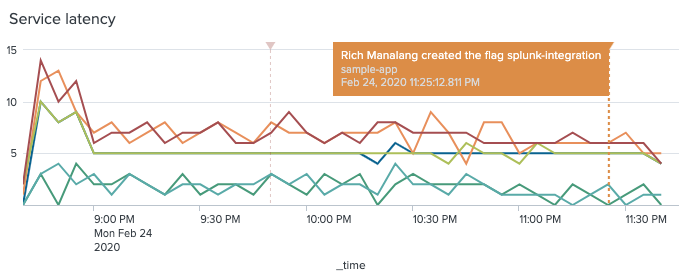
 After LaunchDarkly events start appearing in Splunk, you can create event annotations in your charts in order to show LaunchDarkly events in context.
To learn more, read [Splunk's documentation](https://docs.splunk.com/Documentation/Splunk/latest/Viz/ChartEventAnnotations).
After LaunchDarkly events start appearing in Splunk, you can create event annotations in your charts in order to show LaunchDarkly events in context.
To learn more, read [Splunk's documentation](https://docs.splunk.com/Documentation/Splunk/latest/Viz/ChartEventAnnotations).
 ## Troubleshooting
If LaunchDarkly events don't appear in Splunk, confirm that incoming traffic is allowed. You can also send a single LaunchDarkly test event and verify that Splunk receives it.
### Configure Splunk IP allow lists
Some Splunk customers may need to configure their Splunk IP allow lists to permit incoming traffic from LaunchDarkly. To do this, follow Splunk's [Configure IP allow lists using Splunk Web](https://docs.splunk.com/Documentation/SplunkCloud/latest/Admin/ConfigureIPAllowList) documentation to configure the **HEC access for ingestion** allow list. Add the `outboundAddresses` from LaunchDarkly's [Public IP list](/docs/home/infrastructure/ip-list) when configuring the IP allow list in Splunk.
### Recreate the LaunchDarkly events collector in Splunk
If you configure the LaunchDarkly integration and events in Splunk do not appear, recreate the LaunchDarkly request with a `curl`.
Use this command to recreate the request:
```bash title="curl" lines wrap theme={null}
curl -k \
-X POST \
-H "Authorization: Splunk " \
-d '{"event": "test"}' \
https:///services/collector/event
```
* Splunk Enterprise URLs format: `://:/`.
* Self-service Splunk Cloud URLs format: `://input-:/`.
* Managed Splunk Cloud URLs format: `://http-inputs-:/`.
To learn more, [read Splunk's documentation](https://docs.splunk.com/Documentation/Splunk/latest/Data/UsetheHTTPEventCollector#Send_data_to_HTTP_Event_Collector).
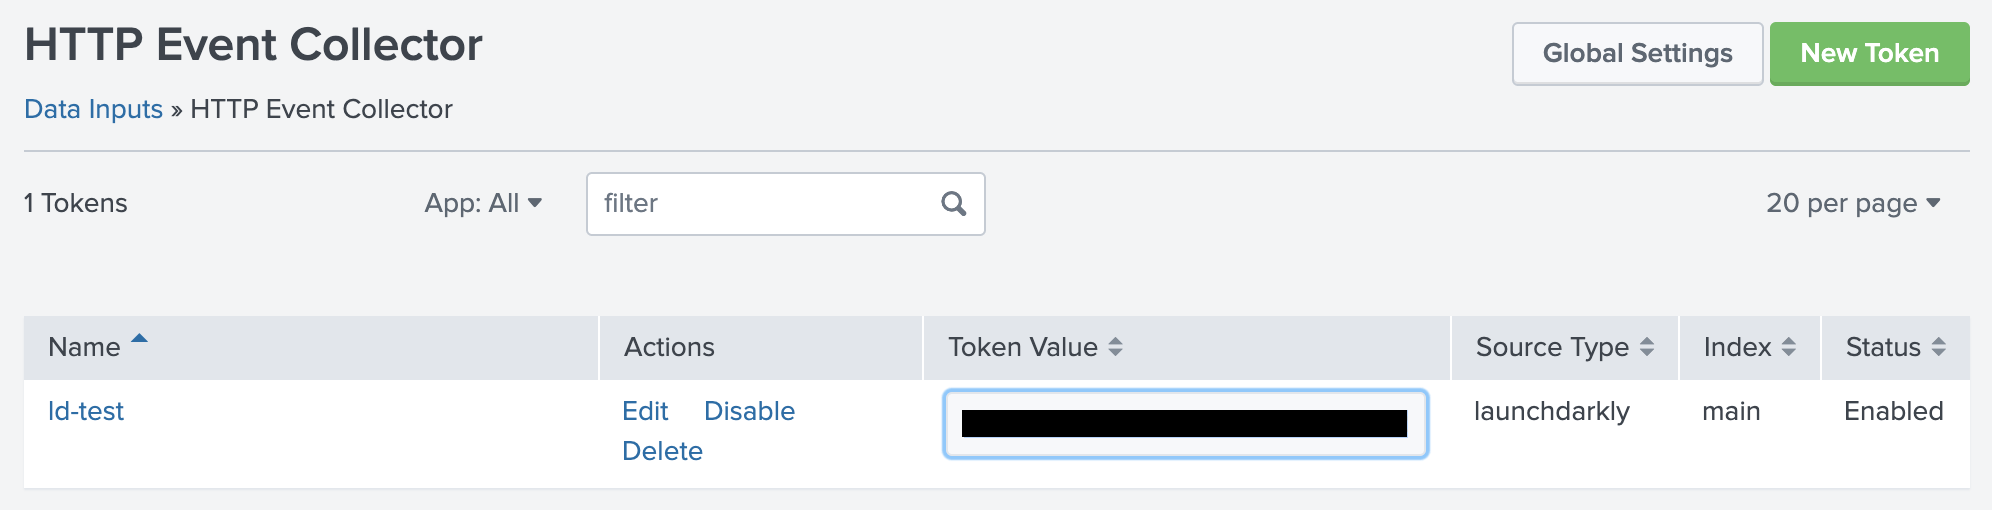
In Splunk, confirm that your **HEC Global Settings** and your specific HEC are set to 'Enabled' and that the **Default Index** type on your token is 'main'.
To search within Splunk for LaunchDarkly events using `sourcetype="launchdarkly"`, set a custom sourcetype on your HEC token.
Set the **Source Type** as `launchdarkly`, set **Index** to `main` and set **Status** to `Enabled`.
An example token is below:
## Troubleshooting
If LaunchDarkly events don't appear in Splunk, confirm that incoming traffic is allowed. You can also send a single LaunchDarkly test event and verify that Splunk receives it.
### Configure Splunk IP allow lists
Some Splunk customers may need to configure their Splunk IP allow lists to permit incoming traffic from LaunchDarkly. To do this, follow Splunk's [Configure IP allow lists using Splunk Web](https://docs.splunk.com/Documentation/SplunkCloud/latest/Admin/ConfigureIPAllowList) documentation to configure the **HEC access for ingestion** allow list. Add the `outboundAddresses` from LaunchDarkly's [Public IP list](/docs/home/infrastructure/ip-list) when configuring the IP allow list in Splunk.
### Recreate the LaunchDarkly events collector in Splunk
If you configure the LaunchDarkly integration and events in Splunk do not appear, recreate the LaunchDarkly request with a `curl`.
Use this command to recreate the request:
```bash title="curl" lines wrap theme={null}
curl -k \
-X POST \
-H "Authorization: Splunk " \
-d '{"event": "test"}' \
https:///services/collector/event
```
* Splunk Enterprise URLs format: `://:/`.
* Self-service Splunk Cloud URLs format: `://input-:/`.
* Managed Splunk Cloud URLs format: `://http-inputs-:/`.
To learn more, [read Splunk's documentation](https://docs.splunk.com/Documentation/Splunk/latest/Data/UsetheHTTPEventCollector#Send_data_to_HTTP_Event_Collector).
In Splunk, confirm that your **HEC Global Settings** and your specific HEC are set to 'Enabled' and that the **Default Index** type on your token is 'main'.
To search within Splunk for LaunchDarkly events using `sourcetype="launchdarkly"`, set a custom sourcetype on your HEC token.
Set the **Source Type** as `launchdarkly`, set **Index** to `main` and set **Status** to `Enabled`.
An example token is below: