> ## Documentation Index
> Fetch the complete documentation index at: https://launchdarkly.com/docs/llms.txt
> Use this file to discover all available pages before exploring further.
# The complete guide to OpenTelemetry in Python
export const BlogAuthor = ({date, avatar, alt, name}) => {
return
Published {date}
{avatar &&

}
{name}
;
};
OpenTelemetry is an important specification that defines how we send telemetry data to observability backends like LaunchDarkly, Grafana, and others. OpenTelemetry is great because it is vendor agnostic, and can be used with several observability backends. If you're new to OpenTelemetry, you can learn more about it [in this YouTube video](https://www.youtube.com/watch?v=ASgosEzG4Pw).
Today, we'll go through a complete guide to using OpenTelemetry in Python, including the high-level concepts as well as how to send traces and logs to your OpenTelemetry backend of choice.
## **Step One: Signals**
In OpenTelemetry, a signal is a type of telemetry data that is collected and sent to an observability backend. There are three primary types of signals in OpenTelemetry: traces, metrics, and logs.
* **Traces**: Traces represent the end-to-end journey of a request as it travels through various services and components in a distributed system. They are composed of spans, which are individual units of work within the trace. Traces help you understand the flow of requests and identify performance bottlenecks or errors in your system.
* **Metrics**: Metrics are numerical measurements that provide insights into the performance and health of your system. They can include data such as request counts, error rates, and latency. Metrics are typically aggregated over time and used to monitor trends and set up alerts.
* **Logs**: Logs are timestamped records of events that occur within your application. They provide detailed information that is helpful for monitoring, debugging and troubleshooting the application's behavior. Logs can include various levels of severity, such as info, warning, and error.
In addition to traces, metrics and logs, there are other constructs that can inherit from a signal. For example, an error can be represented using traces as the underlying data type, providing context about where and why the error occurred. Similarly, sessions can be constructed using several signals, such as traces, metrics, and logs, to provide a holistic view of a user's interaction with the system.
In the context of OpenTelemetry, signals are generated by instrumenting your systems (whether its a container, application, or service).
### **Components of Instrumentation**
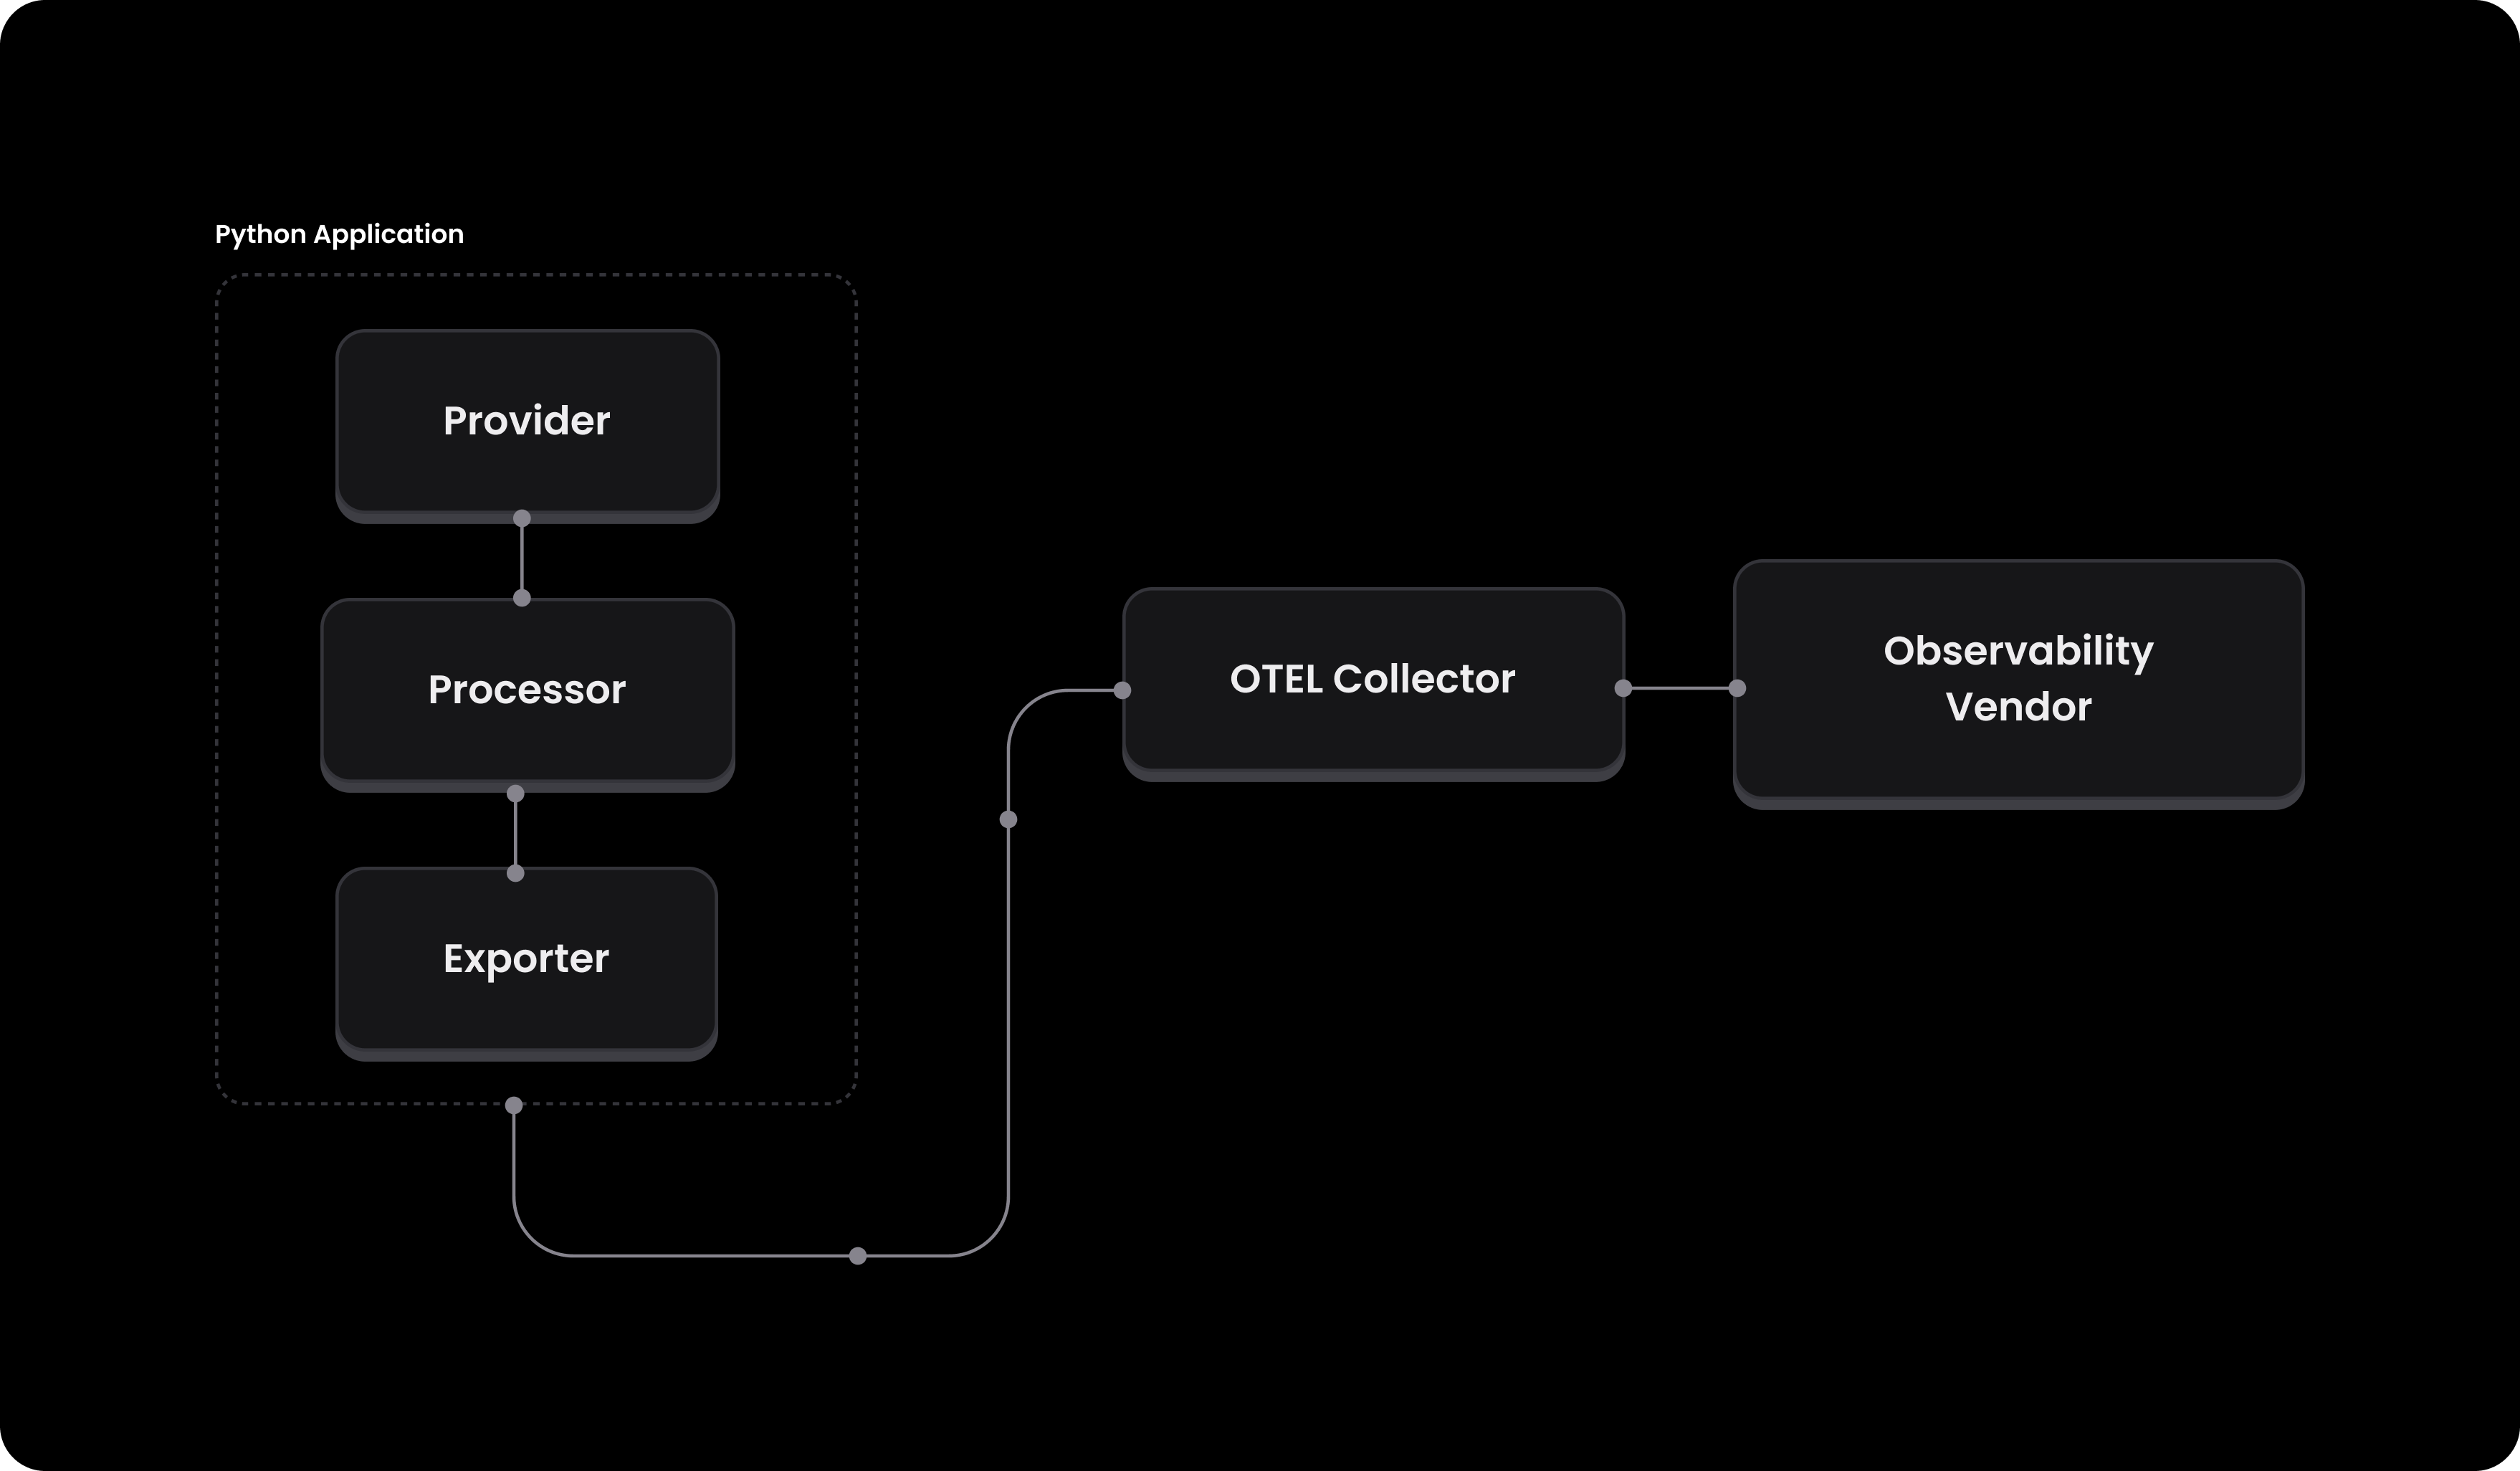
Beyond signals, when working with OpenTelemetry instrumented in your application code, there are several key components that ultimately make up the OpenTelemetry API.
These components are designed to be flexible and can be used for all signals. After these signals leave your application, they then can hit an OpenTelemetry collector (or multiple). In LaunchDarkly, we host a cluster of collectors that can be used to send data to, but you can also choose to host your own. Let's go through each of them. You can refer to the diagram below for a visual representation of how these components interact:
 ### **Provider**
A provider is the API entry point that holds the configuration for telemetry data. In the context of tracing, this would be a `TracerProvider`, and for logging, it would be a `LoggerProvider`. The provider is responsible for setting up the environment and ensuring that all necessary configurations are in place. This can include configuring a vendor specific api key, or something as simple as setting the service name and environment.
For example, a `TracerProvider` could set up the resource attributes like service name and environment, and set the LaunchDarkly project key so that the traces are associated with your LaunchDarkly project.
Here's a quick example of what this looks like in code:
```python lines wrap theme={null}
from opentelemetry import trace
from opentelemetry.sdk.trace import TracerProvider
from opentelemetry.sdk.resources import Resource
provider = TracerProvider(resource=Resource.create(
{
"service.name": "my-service",
"highlight.project_id": "",
"environment": "production",
}
))
trace.set_tracer_provider(provider)
tracer = trace.get_tracer("my-service")
```
### **Processor**
A processor defines any pre-processing that should be done on the created signals, such as batching, sampling, filtering or even enriching data. This is important because you may have specific needs on the machine that you're sending data from that require customization. As a very simple example, a `BatchSpanProcessor` collects spans in batches and sends them to the exporter, which is more efficient than sending each span individually.
Here's an example of how you might configure a `BatchSpanProcessor`:
```python lines wrap theme={null}
from opentelemetry.sdk.trace import TracerProvider
from opentelemetry.sdk.trace.export import BatchSpanProcessor
from opentelemetry.exporter.otlp.proto.grpc.trace_exporter import OTLPSpanExporter
processor = BatchSpanProcessor(
exporter=OTLPSpanExporter(endpoint="https://otel.highlight.io:4317"),
max_queue_size=1000,
max_export_batch_size=100,
schedule_delay_millis=1000,
)
```
As you can see, we've configured the processor to use a `BatchSpanProcessor` with an `OTLPSpanExporter` that sends the spans to the LaunchDarkly collector (more about this later). We've also configured the processor to batch the spans and send them to the exporter every second with a queue size of 1000.
### **Exporter**
Finally, an exporter sends the telemetry data to the backend. This is where you configure the endpoint and any other necessary settings related to the backend you're sending data to. For example, an `OTLPSpanExporter` would configure the endpoint and any necessary headers, while an `ConsoleSpanExporter` would simply print the spans to the console.
Here's an example of how you might configure an `OTLPSpanExporter`:
```python lines wrap theme={null}
from opentelemetry.exporter.otlp.proto.grpc.trace_exporter import OTLPSpanExporter
exporter = OTLPSpanExporter(endpoint="https://otel.highlight.io:4317", insecure=True, headers={ "foo": "bar" })
```
As you can see, we've configured the exporter to use the LaunchDarkly collector, and set the `foo` header to `bar`.
## **Instrumenting your application**
### Logging
Now that we're familiar with the high-level concepts, let's see how we can instrument our application to send logs to an OpenTelemetry backend. In this example, we'll assume that we're sending data to LaunchDarkly, but the same principles would apply to any other backend that supports OpenTelemetry.
First, lets install the necessary packages:
```bash lines wrap theme={null}
pip install opentelemetry-api opentelemetry-sdk opentelemetry-exporter-otlp
```
Next, we'll need to set up the provider, processor, and exporter.
```python expandable lines wrap theme={null}
service_name = "my-service"
environment = "production"
otel_endpoint = "https://otel.highlight.io:4317"
# Set up the logger provider with the resource
logger_provider = LoggerProvider(resource=Resource.create(
{
"service.name": service_name,
"highlight.project_id": "",
"environment": environment,
}
))
set_logger_provider(logger_provider)
# Configure the OTLP log exporter
exporter = OTLPLogExporter(endpoint=otel_endpoint, insecure=True)
logger_provider.add_log_record_processor(BatchLogRecordProcessor(exporter))
# Set up the logger
logger = logging.getLogger(service_name)
logger.setLevel(logging.DEBUG)
# Add the OpenTelemetry logging handler
handler = LoggingHandler(level=logging.DEBUG, logger_provider=logger_provider)
logger.addHandler(handler)
```
### **Tracing**
Similar to logging, we can instrument our application to send traces to an OpenTelemetry backend. Lets start with installing the necessary packages:
```bash lines wrap theme={null}
pip install opentelemetry-api opentelemetry-sdk opentelemetry-exporter-otlp
```
Next, we'll need to set up the provider, processor, and exporter.
```python expandable lines wrap theme={null}
import logging
from opentelemetry import trace
from opentelemetry._logs import set_logger_provider
from opentelemetry.exporter.otlp.proto.grpc._log_exporter import OTLPLogExporter
from opentelemetry.sdk._logs import LoggerProvider, LoggingHandler
from opentelemetry.sdk._logs.export import BatchLogRecordProcessor
from opentelemetry.sdk.resources import Resource
from opentelemetry.sdk.trace import TracerProvider
from opentelemetry.sdk.trace.export import BatchSpanProcessor
from opentelemetry.sdk.trace.export import ConsoleSpanExporter
from opentelemetry.exporter.otlp.proto.grpc.trace_exporter import OTLPSpanExporter
import sys
# Define the service name and environment
service_name = "my-service"
environment = "production"
otel_endpoint = "https://otel.highlight.io:4317"
# Create a resource with service name and highlight project ID
provider = TracerProvider(resource=Resource.create(
{
"service.name": service_name,
"highlight.project_id": "",
"environment": environment,
}
))
processor = BatchSpanProcessor(OTLPSpanExporter(endpoint=otel_endpoint, insecure=True))
provider.add_span_processor(processor)
trace.set_tracer_provider(provider)
tracer = trace.get_tracer(service_name)
```
At this point, once you've instrumented your application to send logs and traces to an OpenTelemetry backend, you can start using the `tracer` and `logger` objects to start sending data to your backend, like so:
```python lines wrap theme={null}
with tracer.start_as_current_span("example-span") as span:
logger.info('hello, world!')
span.set_attributes(
{
"category": "special",
"rows_affected": 123
}
)
logger.warning('whoa there', {'key': 'value'})`,
```
### **Metrics**
Lastly, we can instrument our application to send metrics. In this example, we'll send a simple count metric, but you can also send other types of metrics like histograms, gauges, and more (see the [OpenTelemetry docs](https://opentelemetry.io/docs/specs/otel/metrics/api) for more information).
First, we need to install the necessary OpenTelemetry packages for metrics:
```bash lines wrap theme={null}
pip install opentelemetry-api opentelemetry-sdk opentelemetry-exporter-otlp
```
Next, we'll need to set up the provider, processor, and exporter.
```python expandable lines wrap theme={null}
from opentelemetry import metrics
from opentelemetry.sdk.metrics import MeterProvider, set_meter_provider
from opentelemetry.sdk.metrics.export import ConsoleMetricsExporter
from opentelemetry.sdk.resources import Resource
# Set up the meter provider with the resource
meter_provider = MeterProvider(resource=Resource.create(
{
"service.name": service_name,
"highlight.project_id": "",
"environment": environment,
}
))
set_meter_provider(meter_provider)
meter = metrics.get_meter("my-service")
counter = meter.create_counter("my-counter")
```
And lastly, we can use the meter to create a counter and add a simple value to it:
```python lines wrap theme={null}
counter.add(1)
```
Note that this is a simple example, and you can also create other types of metrics like histograms, gauges, and more. There's also the option to use Observable Metric Objects, which allow for more complex metrics collection (like collecting CPU usage, memory usage, etc). Take a look at the [OpenTelemetry docs](https://opentelemetry-python.readthedocs.io/en/latest/sdk/metrics.html#opentelemetry.sdk.metrics.Meter.create_observable_counter) for more information.
### **Auto-instrumentation & Middleware**
Last but not least, in addition to manual instrumentation, OpenTelemetry also supports auto-instrumentation for popular libraries and frameworks. This allows you to automatically collect telemetry data without having to modify your application code. For example, in Python, you could use the [OpenTelemetry Distro SDK](https://opentelemetry.io/docs/languages/python/distro/) or the [Zero Code Python setup](https://opentelemetry.io/docs/zero-code/python/) to automatically instrument your application. The downside of these options, however, is that it requires that you change the way your application is run (and may affect your deployment strategy).
As a good alternative, you could use middleware to automatically instrument your application. Middleware is a layer of code that sits between your application and the OpenTelemetry backend, and can be used to automatically collect telemetry data. For example, in a Python FastAPI application, you could write a simple middleware to wrap your application and automatically create traces for each request, like so:
```python lines wrap theme={null}
from fastapi import Request, FastAPI
app = FastAPI()
@app.middleware("http")
async def trace_middleware(request, call_next):
with tracer.start_as_current_span(f"{request.method} {request.url.path}"):
response = await call_next(request)
return response
@app.get("/")
def read_root():
return {"message": "Hello, World!"}
```
The great thing about middleware is that it doesn't require that you change the way your application is run, and every time you write signals within each of your endpoints, you'll automatically have traces and logs associated with that request.
## **Putting it all together**
Let's take the various pieces of the OpenTelemetry configuration and put them into a single file that can easily be imported by our application. Create the file `o11y.py` with the following contents:
```python expandable lines wrap theme={null}
import logging
import os
from dotenv import load_dotenv
from typing import Optional
from opentelemetry import metrics, trace
from opentelemetry.sdk.metrics.export import AggregationTemporality
from opentelemetry.sdk.metrics import Counter, Histogram, UpDownCounter
from opentelemetry._logs import set_logger_provider
from opentelemetry.exporter.otlp.proto.grpc._log_exporter import OTLPLogExporter
from opentelemetry.exporter.otlp.proto.grpc.metric_exporter import OTLPMetricExporter
from opentelemetry.exporter.otlp.proto.grpc.trace_exporter import OTLPSpanExporter
from opentelemetry.sdk._logs import LoggerProvider, LoggingHandler
from opentelemetry.sdk._logs.export import BatchLogRecordProcessor, ConsoleLogExporter
from opentelemetry.sdk.metrics import MeterProvider
from opentelemetry.sdk.metrics.export import ConsoleMetricExporter, PeriodicExportingMetricReader
from opentelemetry.sdk.resources import Resource
from opentelemetry.sdk.trace import TracerProvider
from opentelemetry.sdk.trace.export import BatchSpanProcessor, ConsoleSpanExporter
EXPORTER_OTLP_ENDPOINT = os.getenv("OTEL_ENDPOINT","https://otel.highlight.io:4317")
# read from .env
load_dotenv()
print("OTEL Endpoint is: ", EXPORTER_OTLP_ENDPOINT)
HIGHLIGHT_PROJECT_ID = os.getenv("HIGHLIGHT_PROJECT_ID", "EMPTY")
print("HIGHLIGHT_PROJECT_ID is: ", HIGHLIGHT_PROJECT_ID)
import sys
def create_logger(service_name: str, environment: Optional[str] = "production", local_debug: bool = False) -> logging.Logger:
if environment is None:
environment = "production"
commit = os.getenv("RENDER_GIT_COMMIT", "unknown")
resource = Resource.create(
{
"service.name": service_name,
"highlight.project_id": HIGHLIGHT_PROJECT_ID,
"environment": environment,
"commit": commit
}
)
logger_provider = LoggerProvider(resource=resource)
set_logger_provider(logger_provider)
exporter = OTLPLogExporter(endpoint=EXPORTER_OTLP_ENDPOINT, insecure=True) if not local_debug else ConsoleLogExporter()
logger_provider.add_log_record_processor(BatchLogRecordProcessor(exporter))
logger = logging.getLogger(service_name)
logger.setLevel(logging.DEBUG)
handler = LoggingHandler(level=logging.DEBUG, logger_provider=logger_provider)
logger.addHandler(handler)
# Add console handler for stdout
console_handler = logging.StreamHandler(sys.stdout)
console_handler.setLevel(logging.DEBUG)
if commit:
formatter = logging.Formatter('commit: ' + commit + ' - %(asctime)s - %(name)s - %(levelname)s - %(message)s')
else:
formatter = logging.Formatter('%(asctime)s - %(name)s - %(levelname)s - %(message)s')
console_handler.setFormatter(formatter)
logger.addHandler(console_handler)
return logger
def create_tracer(
service_name: str,
environment: Optional[str] = "production",
local_debug: bool = False
) -> trace.Tracer:
if environment is None:
environment = "production"
commit = os.getenv("RENDER_GIT_COMMIT", "unknown")
provider = TracerProvider(resource=Resource.create(
{
"service.name": service_name,
"highlight.project_id": HIGHLIGHT_PROJECT_ID,
"environment": environment,
"commit": commit
}
))
processor = BatchSpanProcessor(OTLPSpanExporter(endpoint=EXPORTER_OTLP_ENDPOINT, insecure=True)) if not local_debug else BatchSpanProcessor(ConsoleSpanExporter())
provider.add_span_processor(processor)
trace.set_tracer_provider(provider)
tracer = trace.get_tracer(service_name)
return tracer
def get_meter(service_name: str, environment: Optional[str] = "production", local_debug: bool = False) -> metrics.Meter:
if environment is None:
environment = "production"
commit = os.getenv("RENDER_GIT_COMMIT", "unknown")
preferred_temporality: dict[type, AggregationTemporality] = {
Counter: AggregationTemporality.DELTA,
UpDownCounter: AggregationTemporality.DELTA,
Histogram: AggregationTemporality.DELTA,
}
readers = [PeriodicExportingMetricReader(exporter=OTLPMetricExporter(endpoint=EXPORTER_OTLP_ENDPOINT, insecure=True, preferred_temporality=preferred_temporality))]
if local_debug:
readers.append(PeriodicExportingMetricReader(exporter=ConsoleMetricExporter(
preferred_temporality=preferred_temporality
), export_interval_millis=1000))
provider = MeterProvider(resource=Resource.create(
{
"service.name": service_name,
"highlight.project_id": HIGHLIGHT_PROJECT_ID,
"environment": environment,
"commit": commit
}
), metric_readers=readers)
metrics.set_meter_provider(provider)
meter = metrics.get_meter(service_name)
return meter
```
Now, let's use the setup from our Flask app. In our app entrypoint `main.py`, we just need to set up the OpenTelemetry resources:
```python lines wrap theme={null}
import os
from o11y import create_logger, create_tracer, get_meter
# Initialize observability tools
service_name = "flask-backend"
logger = create_logger(service_name, os.getenv("ENVIRONMENT"))
tracer = create_tracer(service_name, os.getenv("ENVIRONMENT"))
meter = get_meter(service_name, os.getenv("ENVIRONMENT"))
histogram = meter.create_histogram("request_duration_histogram")
gauge = meter.create_gauge("request_duration_gauge")
counter = meter.create_counter("request_count")
logger.info("Starting the application")
```
See the complete example in our [Python Flask OTel github repository](https://github.com/highlight/otel-flask-example).
## **Conclusion**
In this guide, we've gone through everything you need to use OpenTelemetry in Python, including the high-level concepts as well as how to send traces and logs to your OpenTelemetry backend of choice.
If you have any questions, reach out to us on [Twitter](https://x.com/launchdarkly) or [Discord](https://launchdarkly.com/community).
### **Provider**
A provider is the API entry point that holds the configuration for telemetry data. In the context of tracing, this would be a `TracerProvider`, and for logging, it would be a `LoggerProvider`. The provider is responsible for setting up the environment and ensuring that all necessary configurations are in place. This can include configuring a vendor specific api key, or something as simple as setting the service name and environment.
For example, a `TracerProvider` could set up the resource attributes like service name and environment, and set the LaunchDarkly project key so that the traces are associated with your LaunchDarkly project.
Here's a quick example of what this looks like in code:
```python lines wrap theme={null}
from opentelemetry import trace
from opentelemetry.sdk.trace import TracerProvider
from opentelemetry.sdk.resources import Resource
provider = TracerProvider(resource=Resource.create(
{
"service.name": "my-service",
"highlight.project_id": "",
"environment": "production",
}
))
trace.set_tracer_provider(provider)
tracer = trace.get_tracer("my-service")
```
### **Processor**
A processor defines any pre-processing that should be done on the created signals, such as batching, sampling, filtering or even enriching data. This is important because you may have specific needs on the machine that you're sending data from that require customization. As a very simple example, a `BatchSpanProcessor` collects spans in batches and sends them to the exporter, which is more efficient than sending each span individually.
Here's an example of how you might configure a `BatchSpanProcessor`:
```python lines wrap theme={null}
from opentelemetry.sdk.trace import TracerProvider
from opentelemetry.sdk.trace.export import BatchSpanProcessor
from opentelemetry.exporter.otlp.proto.grpc.trace_exporter import OTLPSpanExporter
processor = BatchSpanProcessor(
exporter=OTLPSpanExporter(endpoint="https://otel.highlight.io:4317"),
max_queue_size=1000,
max_export_batch_size=100,
schedule_delay_millis=1000,
)
```
As you can see, we've configured the processor to use a `BatchSpanProcessor` with an `OTLPSpanExporter` that sends the spans to the LaunchDarkly collector (more about this later). We've also configured the processor to batch the spans and send them to the exporter every second with a queue size of 1000.
### **Exporter**
Finally, an exporter sends the telemetry data to the backend. This is where you configure the endpoint and any other necessary settings related to the backend you're sending data to. For example, an `OTLPSpanExporter` would configure the endpoint and any necessary headers, while an `ConsoleSpanExporter` would simply print the spans to the console.
Here's an example of how you might configure an `OTLPSpanExporter`:
```python lines wrap theme={null}
from opentelemetry.exporter.otlp.proto.grpc.trace_exporter import OTLPSpanExporter
exporter = OTLPSpanExporter(endpoint="https://otel.highlight.io:4317", insecure=True, headers={ "foo": "bar" })
```
As you can see, we've configured the exporter to use the LaunchDarkly collector, and set the `foo` header to `bar`.
## **Instrumenting your application**
### Logging
Now that we're familiar with the high-level concepts, let's see how we can instrument our application to send logs to an OpenTelemetry backend. In this example, we'll assume that we're sending data to LaunchDarkly, but the same principles would apply to any other backend that supports OpenTelemetry.
First, lets install the necessary packages:
```bash lines wrap theme={null}
pip install opentelemetry-api opentelemetry-sdk opentelemetry-exporter-otlp
```
Next, we'll need to set up the provider, processor, and exporter.
```python expandable lines wrap theme={null}
service_name = "my-service"
environment = "production"
otel_endpoint = "https://otel.highlight.io:4317"
# Set up the logger provider with the resource
logger_provider = LoggerProvider(resource=Resource.create(
{
"service.name": service_name,
"highlight.project_id": "",
"environment": environment,
}
))
set_logger_provider(logger_provider)
# Configure the OTLP log exporter
exporter = OTLPLogExporter(endpoint=otel_endpoint, insecure=True)
logger_provider.add_log_record_processor(BatchLogRecordProcessor(exporter))
# Set up the logger
logger = logging.getLogger(service_name)
logger.setLevel(logging.DEBUG)
# Add the OpenTelemetry logging handler
handler = LoggingHandler(level=logging.DEBUG, logger_provider=logger_provider)
logger.addHandler(handler)
```
### **Tracing**
Similar to logging, we can instrument our application to send traces to an OpenTelemetry backend. Lets start with installing the necessary packages:
```bash lines wrap theme={null}
pip install opentelemetry-api opentelemetry-sdk opentelemetry-exporter-otlp
```
Next, we'll need to set up the provider, processor, and exporter.
```python expandable lines wrap theme={null}
import logging
from opentelemetry import trace
from opentelemetry._logs import set_logger_provider
from opentelemetry.exporter.otlp.proto.grpc._log_exporter import OTLPLogExporter
from opentelemetry.sdk._logs import LoggerProvider, LoggingHandler
from opentelemetry.sdk._logs.export import BatchLogRecordProcessor
from opentelemetry.sdk.resources import Resource
from opentelemetry.sdk.trace import TracerProvider
from opentelemetry.sdk.trace.export import BatchSpanProcessor
from opentelemetry.sdk.trace.export import ConsoleSpanExporter
from opentelemetry.exporter.otlp.proto.grpc.trace_exporter import OTLPSpanExporter
import sys
# Define the service name and environment
service_name = "my-service"
environment = "production"
otel_endpoint = "https://otel.highlight.io:4317"
# Create a resource with service name and highlight project ID
provider = TracerProvider(resource=Resource.create(
{
"service.name": service_name,
"highlight.project_id": "",
"environment": environment,
}
))
processor = BatchSpanProcessor(OTLPSpanExporter(endpoint=otel_endpoint, insecure=True))
provider.add_span_processor(processor)
trace.set_tracer_provider(provider)
tracer = trace.get_tracer(service_name)
```
At this point, once you've instrumented your application to send logs and traces to an OpenTelemetry backend, you can start using the `tracer` and `logger` objects to start sending data to your backend, like so:
```python lines wrap theme={null}
with tracer.start_as_current_span("example-span") as span:
logger.info('hello, world!')
span.set_attributes(
{
"category": "special",
"rows_affected": 123
}
)
logger.warning('whoa there', {'key': 'value'})`,
```
### **Metrics**
Lastly, we can instrument our application to send metrics. In this example, we'll send a simple count metric, but you can also send other types of metrics like histograms, gauges, and more (see the [OpenTelemetry docs](https://opentelemetry.io/docs/specs/otel/metrics/api) for more information).
First, we need to install the necessary OpenTelemetry packages for metrics:
```bash lines wrap theme={null}
pip install opentelemetry-api opentelemetry-sdk opentelemetry-exporter-otlp
```
Next, we'll need to set up the provider, processor, and exporter.
```python expandable lines wrap theme={null}
from opentelemetry import metrics
from opentelemetry.sdk.metrics import MeterProvider, set_meter_provider
from opentelemetry.sdk.metrics.export import ConsoleMetricsExporter
from opentelemetry.sdk.resources import Resource
# Set up the meter provider with the resource
meter_provider = MeterProvider(resource=Resource.create(
{
"service.name": service_name,
"highlight.project_id": "",
"environment": environment,
}
))
set_meter_provider(meter_provider)
meter = metrics.get_meter("my-service")
counter = meter.create_counter("my-counter")
```
And lastly, we can use the meter to create a counter and add a simple value to it:
```python lines wrap theme={null}
counter.add(1)
```
Note that this is a simple example, and you can also create other types of metrics like histograms, gauges, and more. There's also the option to use Observable Metric Objects, which allow for more complex metrics collection (like collecting CPU usage, memory usage, etc). Take a look at the [OpenTelemetry docs](https://opentelemetry-python.readthedocs.io/en/latest/sdk/metrics.html#opentelemetry.sdk.metrics.Meter.create_observable_counter) for more information.
### **Auto-instrumentation & Middleware**
Last but not least, in addition to manual instrumentation, OpenTelemetry also supports auto-instrumentation for popular libraries and frameworks. This allows you to automatically collect telemetry data without having to modify your application code. For example, in Python, you could use the [OpenTelemetry Distro SDK](https://opentelemetry.io/docs/languages/python/distro/) or the [Zero Code Python setup](https://opentelemetry.io/docs/zero-code/python/) to automatically instrument your application. The downside of these options, however, is that it requires that you change the way your application is run (and may affect your deployment strategy).
As a good alternative, you could use middleware to automatically instrument your application. Middleware is a layer of code that sits between your application and the OpenTelemetry backend, and can be used to automatically collect telemetry data. For example, in a Python FastAPI application, you could write a simple middleware to wrap your application and automatically create traces for each request, like so:
```python lines wrap theme={null}
from fastapi import Request, FastAPI
app = FastAPI()
@app.middleware("http")
async def trace_middleware(request, call_next):
with tracer.start_as_current_span(f"{request.method} {request.url.path}"):
response = await call_next(request)
return response
@app.get("/")
def read_root():
return {"message": "Hello, World!"}
```
The great thing about middleware is that it doesn't require that you change the way your application is run, and every time you write signals within each of your endpoints, you'll automatically have traces and logs associated with that request.
## **Putting it all together**
Let's take the various pieces of the OpenTelemetry configuration and put them into a single file that can easily be imported by our application. Create the file `o11y.py` with the following contents:
```python expandable lines wrap theme={null}
import logging
import os
from dotenv import load_dotenv
from typing import Optional
from opentelemetry import metrics, trace
from opentelemetry.sdk.metrics.export import AggregationTemporality
from opentelemetry.sdk.metrics import Counter, Histogram, UpDownCounter
from opentelemetry._logs import set_logger_provider
from opentelemetry.exporter.otlp.proto.grpc._log_exporter import OTLPLogExporter
from opentelemetry.exporter.otlp.proto.grpc.metric_exporter import OTLPMetricExporter
from opentelemetry.exporter.otlp.proto.grpc.trace_exporter import OTLPSpanExporter
from opentelemetry.sdk._logs import LoggerProvider, LoggingHandler
from opentelemetry.sdk._logs.export import BatchLogRecordProcessor, ConsoleLogExporter
from opentelemetry.sdk.metrics import MeterProvider
from opentelemetry.sdk.metrics.export import ConsoleMetricExporter, PeriodicExportingMetricReader
from opentelemetry.sdk.resources import Resource
from opentelemetry.sdk.trace import TracerProvider
from opentelemetry.sdk.trace.export import BatchSpanProcessor, ConsoleSpanExporter
EXPORTER_OTLP_ENDPOINT = os.getenv("OTEL_ENDPOINT","https://otel.highlight.io:4317")
# read from .env
load_dotenv()
print("OTEL Endpoint is: ", EXPORTER_OTLP_ENDPOINT)
HIGHLIGHT_PROJECT_ID = os.getenv("HIGHLIGHT_PROJECT_ID", "EMPTY")
print("HIGHLIGHT_PROJECT_ID is: ", HIGHLIGHT_PROJECT_ID)
import sys
def create_logger(service_name: str, environment: Optional[str] = "production", local_debug: bool = False) -> logging.Logger:
if environment is None:
environment = "production"
commit = os.getenv("RENDER_GIT_COMMIT", "unknown")
resource = Resource.create(
{
"service.name": service_name,
"highlight.project_id": HIGHLIGHT_PROJECT_ID,
"environment": environment,
"commit": commit
}
)
logger_provider = LoggerProvider(resource=resource)
set_logger_provider(logger_provider)
exporter = OTLPLogExporter(endpoint=EXPORTER_OTLP_ENDPOINT, insecure=True) if not local_debug else ConsoleLogExporter()
logger_provider.add_log_record_processor(BatchLogRecordProcessor(exporter))
logger = logging.getLogger(service_name)
logger.setLevel(logging.DEBUG)
handler = LoggingHandler(level=logging.DEBUG, logger_provider=logger_provider)
logger.addHandler(handler)
# Add console handler for stdout
console_handler = logging.StreamHandler(sys.stdout)
console_handler.setLevel(logging.DEBUG)
if commit:
formatter = logging.Formatter('commit: ' + commit + ' - %(asctime)s - %(name)s - %(levelname)s - %(message)s')
else:
formatter = logging.Formatter('%(asctime)s - %(name)s - %(levelname)s - %(message)s')
console_handler.setFormatter(formatter)
logger.addHandler(console_handler)
return logger
def create_tracer(
service_name: str,
environment: Optional[str] = "production",
local_debug: bool = False
) -> trace.Tracer:
if environment is None:
environment = "production"
commit = os.getenv("RENDER_GIT_COMMIT", "unknown")
provider = TracerProvider(resource=Resource.create(
{
"service.name": service_name,
"highlight.project_id": HIGHLIGHT_PROJECT_ID,
"environment": environment,
"commit": commit
}
))
processor = BatchSpanProcessor(OTLPSpanExporter(endpoint=EXPORTER_OTLP_ENDPOINT, insecure=True)) if not local_debug else BatchSpanProcessor(ConsoleSpanExporter())
provider.add_span_processor(processor)
trace.set_tracer_provider(provider)
tracer = trace.get_tracer(service_name)
return tracer
def get_meter(service_name: str, environment: Optional[str] = "production", local_debug: bool = False) -> metrics.Meter:
if environment is None:
environment = "production"
commit = os.getenv("RENDER_GIT_COMMIT", "unknown")
preferred_temporality: dict[type, AggregationTemporality] = {
Counter: AggregationTemporality.DELTA,
UpDownCounter: AggregationTemporality.DELTA,
Histogram: AggregationTemporality.DELTA,
}
readers = [PeriodicExportingMetricReader(exporter=OTLPMetricExporter(endpoint=EXPORTER_OTLP_ENDPOINT, insecure=True, preferred_temporality=preferred_temporality))]
if local_debug:
readers.append(PeriodicExportingMetricReader(exporter=ConsoleMetricExporter(
preferred_temporality=preferred_temporality
), export_interval_millis=1000))
provider = MeterProvider(resource=Resource.create(
{
"service.name": service_name,
"highlight.project_id": HIGHLIGHT_PROJECT_ID,
"environment": environment,
"commit": commit
}
), metric_readers=readers)
metrics.set_meter_provider(provider)
meter = metrics.get_meter(service_name)
return meter
```
Now, let's use the setup from our Flask app. In our app entrypoint `main.py`, we just need to set up the OpenTelemetry resources:
```python lines wrap theme={null}
import os
from o11y import create_logger, create_tracer, get_meter
# Initialize observability tools
service_name = "flask-backend"
logger = create_logger(service_name, os.getenv("ENVIRONMENT"))
tracer = create_tracer(service_name, os.getenv("ENVIRONMENT"))
meter = get_meter(service_name, os.getenv("ENVIRONMENT"))
histogram = meter.create_histogram("request_duration_histogram")
gauge = meter.create_gauge("request_duration_gauge")
counter = meter.create_counter("request_count")
logger.info("Starting the application")
```
See the complete example in our [Python Flask OTel github repository](https://github.com/highlight/otel-flask-example).
## **Conclusion**
In this guide, we've gone through everything you need to use OpenTelemetry in Python, including the high-level concepts as well as how to send traces and logs to your OpenTelemetry backend of choice.
If you have any questions, reach out to us on [Twitter](https://x.com/launchdarkly) or [Discord](https://launchdarkly.com/community).