> ## Documentation Index
> Fetch the complete documentation index at: https://launchdarkly.com/docs/llms.txt
> Use this file to discover all available pages before exploring further.
# Tracing distributed systems in Next.js
export const BlogAuthor = ({date, avatar, alt, name}) => {
return
Published {date}
{avatar && }
{name}
;
};
[](https://youtube.com/live/z9g-eOPwndk)
## Distributed Tracing
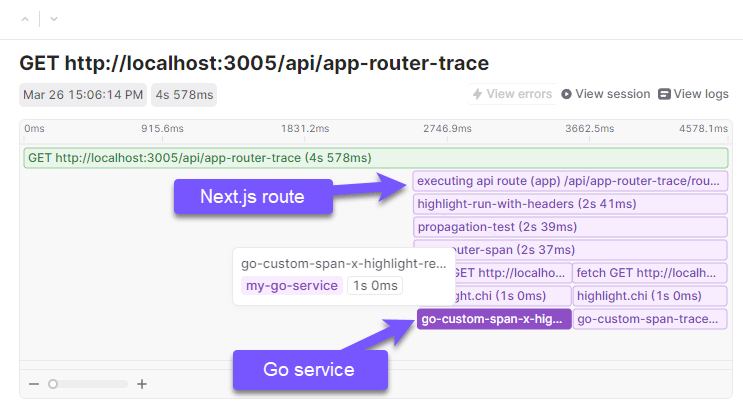
Distributed tracing is crucial for debugging and improving system performance. Instead of looking at the performance of each service in isolation, distributed tracing links traces across services to show how a request flows through a system. For instance, a trace might start in a React web client, pass through a Next.js API, and continue across subsequent HTTP calls, keeping all activities under one umbrella. This not only simplifies tracking but also provides a clear, consolidated view of how different parts of your application interact.
## Approach
In this post, we’ll go over a practical example of how tracing across multiple services work in the context of a modern NextJS application.
We will demonstrate how to use LaunchDarkly to connect a NextJS application with an external service by passing HTTP headers in the following steps:
* **Next Client:** The web client initiates an HTTP `Fetch` request, passing the `x-highlight-request` header which contains a generated `sessionId` and `requestId`.
* **Next Server:** A Next.js API function receives that request, associates the `sessionId` and `requestId` to it's local trace, then passes the `x-highlight-request` header to a third service, this time written in Golang.
* **Go Server:** The Golang service receives the `x-highlight-request` header and associates it to the local trace.
## Instrumenting the Next.js web client
Client-side integration requires initializing the LaunchDarkly SDK and its observability plugins in your web app.
* Initialize the SDK once, preferably in a `layout.tsx` file or `_app.tsx` file.
* The observability plugin accepts configuration options documented in the JavaScript SDK's [options reference](/docs/sdk/features/observability-config-client-side).
* Explore LaunchDarkly's [session replay configuration options](/docs/sdk/features/session-replay-config), including:
* Canvas and WebGL capture,
* Privacy and redaction settings
```typescript expandable lines wrap theme={null}
// app/layout.tsx
import { CONSTANTS } from "../constants";
import { HighlightInit } from "@highlight-run/next/client";
export default function RootLayout({
children,
}: {
children: React.ReactNode;
}) {
return (
<>
{children}
);
}
```
### Calling the Next.js API function
We'll use the browser's `Fetch` API to call a Next.js API function. With `tracingOrigins` configured, the LaunchDarkly observability plugin monkey patches `window.fetch` and automatically adds a `traceparent` header to matching requests, so use `Fetch` as you normally would.
Read about the full [list of monkey patched browser APIs](/docs/sdk/features/observability-config-client-side#browser-apis-subject-to-monkey-patching) in our docs.
```javascript lines wrap theme={null}
```
First, create a wrapper function around your API route handler. Use the LaunchDarkly observability plugin to capture incoming request headers and wrap the handler in a custom span.
In this case, we're using the App Router. For SDK setup and configuration details, read the [JavaScript SDK observability reference](/docs/sdk/observability/javascript). For a walkthrough of instrumenting Next.js App Router routes specifically, read [How to use OpenTelemetry to monitor Next.js apps](/docs/tutorials/how-to-use-opentelemetry-to-monitor-nextjs-apps).
```typescript lines wrap theme={null}
// utils/app-router-highlight.config.ts:
import { AppRouterHighlight } from "@highlight-run/next/server";
import { CONSTANTS } from "../../constants";
export const withAppRouterHighlight = AppRouterHighlight({
projectID: CONSTANTS.ENV.HIGHLIGHT.PROJECT_ID,
});
```
Next, we wrap our `GET` handler function. Note that we wrap our handler function with `withAppRouterHighlight`, and we forward `request.headers` along with the next HTTP request.
The `x-highlight-request` header is only header that matters in this example.
```typescript expandable lines wrap theme={null}
// app/propagation-test/route.ts
import { NextRequest } from "next/server";
import { withAppRouterHighlight } from "../_utils/app-router-highlight.config";
export const GET = withAppRouterHighlight(async (request: NextRequest) => {
console.info("Here: app/propagation-test/route.ts");
const response = await fetch("http://localhost:3010/test", {
method: "GET",
headers: request.headers, // x-highlight-request is the critical header
});
const data = await response.text();
return new Response(data);
});
```
### Configure our Golang service
### Configure your Go service
The LaunchDarkly Go SDK supports observability through a dedicated [observability plugin](/docs/sdk/observability/go). This example uses that plugin alongside the chi router.
First, configure the observability plugin, provided by the `github.com/launchdarkly/observability-sdk/go` package:
```go lines wrap theme={null}
import (
"github.com/highlight/highlight/sdk/highlight-go"
)
func main() {
// ...
highlight.SetProjectID("")
highlight.Start(
highlight.WithServiceName("my-app"),
highlight.WithServiceVersion("git-sha"),
)
defer highlight.Stop()
// ...
}
```
Next we add the Chi middleware.
```go lines wrap theme={null}
import (
highlightChi "github.com/highlight/highlight/sdk/highlight-go/middleware/chi"
)
func main() {
// ...
r := chi.NewRouter()
r.Use(highlightChi.Middleware)
// ...
}
```
The `highlightChi.Middleware` function will automatically associate the current request with the incoming `x-highlight-request` header.
### W3C traceparent example code
We used the `x-highlight-request` header in this example, but we also tested [OpenTelemetry's native JavaScript Propagation](https://opentelemetry.io/docs/languages/js/propagation/) example using the [W3C traceparent](https://www.w3.org/TR/trace-context/#traceparent-header) header.
Instead of passing `x-highlight-request` header, it is possible to pass a `traceparent` header across HTTP calls. It's a bit involved, but it works great. See the links below for example code:
* [withPropagation](https://github.com/highlight/highlight/blob/e18566beeab5960f14e9e374e148cfef52f5630c/e2e/nextjs/src/app/_utils/app-router-highlight.config.ts#L23): an example wrapper for Next.js
* [GET route](https://github.com/highlight/highlight/blob/e18566beeab5960f14e9e374e148cfef52f5630c/e2e/nextjs/src/app/api/app-router-trace/route.ts#L22): Pass `request.headers` along as before.
* [Golang example](https://github.com/highlight/highlight/blob/e18566beeab5960f14e9e374e148cfef52f5630c/e2e/nextjs/go-service/main.go#L74): Associate the incoming `traceparent` header with a local trace.
### Result
All three services, the web client, the Next.js API function, and the Golang backend, now feed their data to the same LaunchDarkly project.
For the purposes of example, we can even visualize this data in our product, LaunchDarkly!
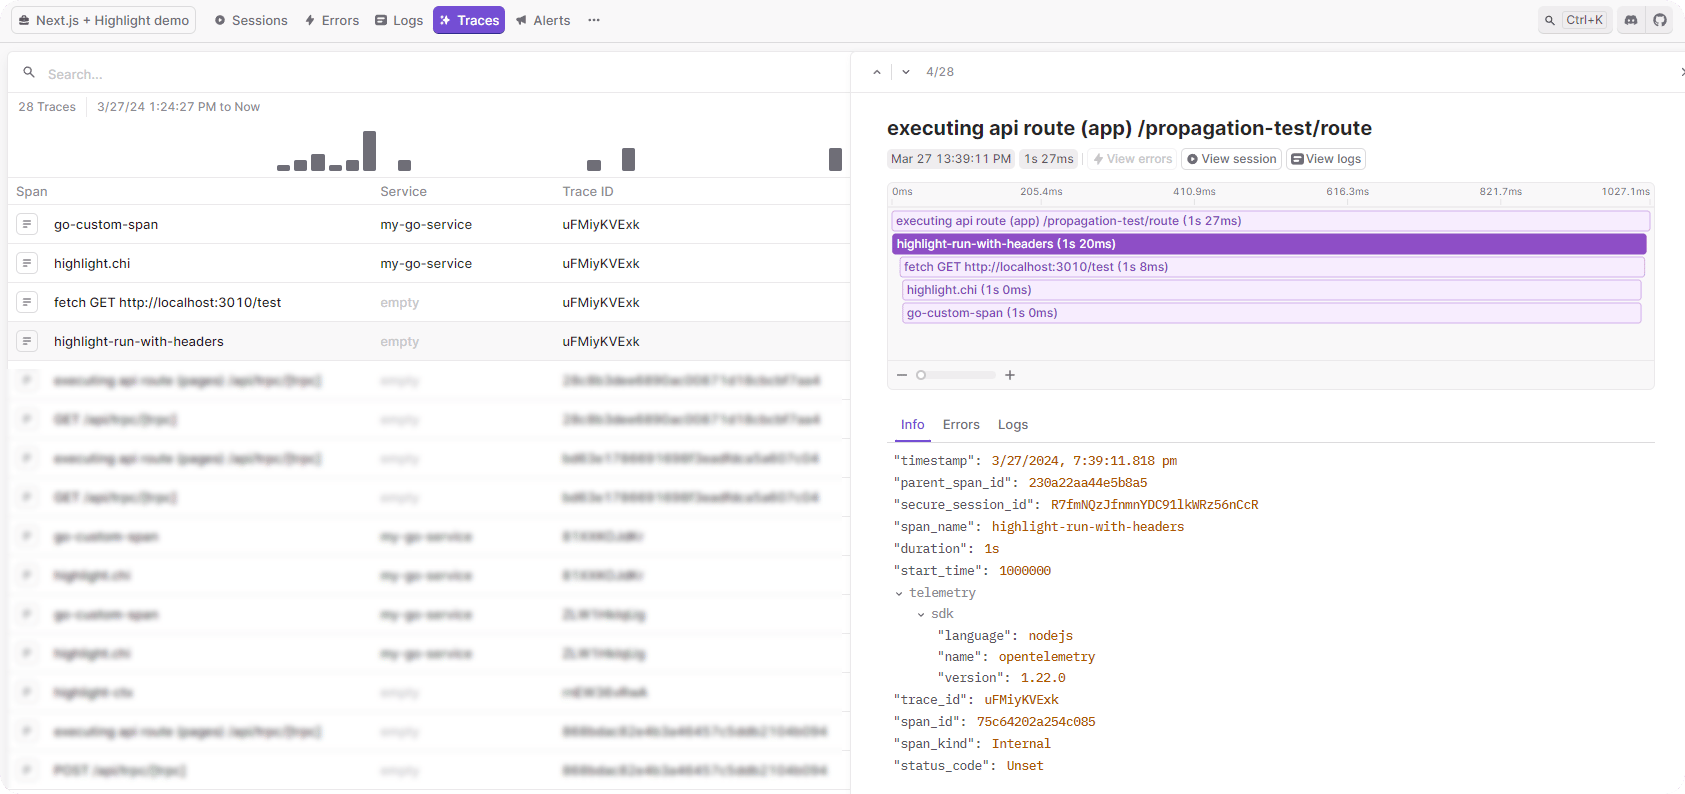
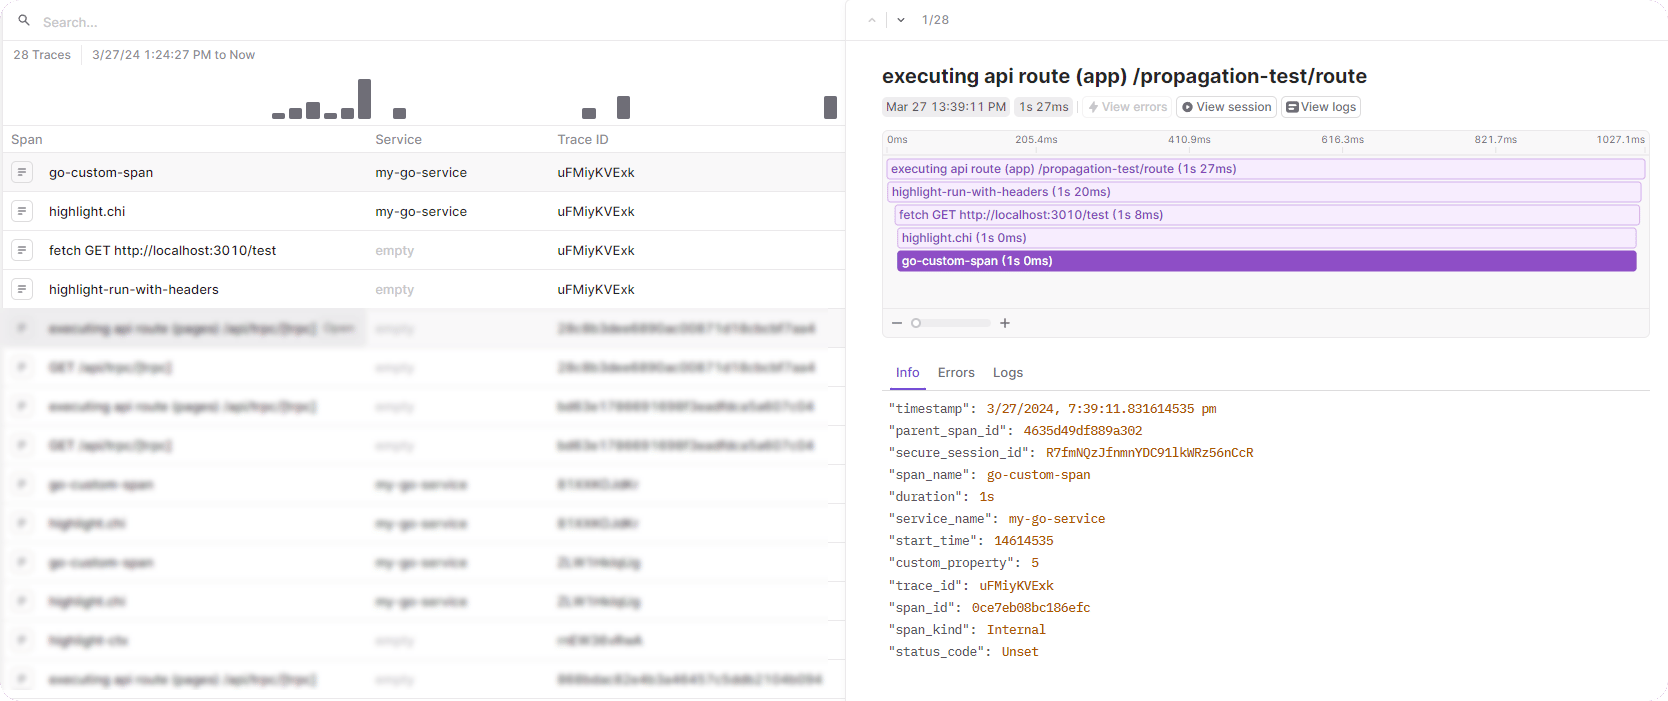
This example shows four separate spans, all of which are nested under a single trace. And of course, these traces are accessible from the LaunchDarkly Session Replay tab, because the session was generated in the web client and propagated throughout the entire distributed "call stack".
* `highlight-run-with-headers` is generated by the `AppRouterHighlight` wrapper function in Next.js.
* `fetch GET https://localhost:3010/test` is generated by the Next.js `Fetch` request.
* `highlight.chi` is created by LaunchDarkly's chi middleware.
* `go-custom-span` is a custom span that we used in our example code for demonstration purposes. It wraps a call to `time.Sleep(1 * time.Second)` to mimic slow code execution.
**highlight-run-with-headers**
**go-custom-span**
 }
}
 ](https://youtube.com/live/z9g-eOPwndk)
## Distributed Tracing
Distributed tracing is crucial for debugging and improving system performance. Instead of looking at the performance of each service in isolation, distributed tracing links traces across services to show how a request flows through a system. For instance, a trace might start in a React web client, pass through a Next.js API, and continue across subsequent HTTP calls, keeping all activities under one umbrella. This not only simplifies tracking but also provides a clear, consolidated view of how different parts of your application interact.
](https://youtube.com/live/z9g-eOPwndk)
## Distributed Tracing
Distributed tracing is crucial for debugging and improving system performance. Instead of looking at the performance of each service in isolation, distributed tracing links traces across services to show how a request flows through a system. For instance, a trace might start in a React web client, pass through a Next.js API, and continue across subsequent HTTP calls, keeping all activities under one umbrella. This not only simplifies tracking but also provides a clear, consolidated view of how different parts of your application interact.
 ## Approach
In this post, we’ll go over a practical example of how tracing across multiple services work in the context of a modern NextJS application.
We will demonstrate how to use LaunchDarkly to connect a NextJS application with an external service by passing HTTP headers in the following steps:
* **Next Client:** The web client initiates an HTTP `Fetch` request, passing the `x-highlight-request` header which contains a generated `sessionId` and `requestId`.
* **Next Server:** A Next.js API function receives that request, associates the `sessionId` and `requestId` to it's local trace, then passes the `x-highlight-request` header to a third service, this time written in Golang.
* **Go Server:** The Golang service receives the `x-highlight-request` header and associates it to the local trace.
## Instrumenting the Next.js web client
Client-side integration requires initializing the LaunchDarkly SDK and its observability plugins in your web app.
* Initialize the SDK once, preferably in a `layout.tsx` file or `_app.tsx` file.
* The observability plugin accepts configuration options documented in the JavaScript SDK's [options reference](/docs/sdk/features/observability-config-client-side).
* Explore LaunchDarkly's [session replay configuration options](/docs/sdk/features/session-replay-config), including:
* Canvas and WebGL capture,
* Privacy and redaction settings
```typescript expandable lines wrap theme={null}
// app/layout.tsx
import { CONSTANTS } from "../constants";
import { HighlightInit } from "@highlight-run/next/client";
export default function RootLayout({
children,
}: {
children: React.ReactNode;
}) {
return (
<>
## Approach
In this post, we’ll go over a practical example of how tracing across multiple services work in the context of a modern NextJS application.
We will demonstrate how to use LaunchDarkly to connect a NextJS application with an external service by passing HTTP headers in the following steps:
* **Next Client:** The web client initiates an HTTP `Fetch` request, passing the `x-highlight-request` header which contains a generated `sessionId` and `requestId`.
* **Next Server:** A Next.js API function receives that request, associates the `sessionId` and `requestId` to it's local trace, then passes the `x-highlight-request` header to a third service, this time written in Golang.
* **Go Server:** The Golang service receives the `x-highlight-request` header and associates it to the local trace.
## Instrumenting the Next.js web client
Client-side integration requires initializing the LaunchDarkly SDK and its observability plugins in your web app.
* Initialize the SDK once, preferably in a `layout.tsx` file or `_app.tsx` file.
* The observability plugin accepts configuration options documented in the JavaScript SDK's [options reference](/docs/sdk/features/observability-config-client-side).
* Explore LaunchDarkly's [session replay configuration options](/docs/sdk/features/session-replay-config), including:
* Canvas and WebGL capture,
* Privacy and redaction settings
```typescript expandable lines wrap theme={null}
// app/layout.tsx
import { CONSTANTS } from "../constants";
import { HighlightInit } from "@highlight-run/next/client";
export default function RootLayout({
children,
}: {
children: React.ReactNode;
}) {
return (
<>
 **highlight-run-with-headers**
 **go-custom-span**