


Engineering teams are shipping faster than ever, but incidents, rollbacks, and firefighting haven’t gone away. Most metrics about the speed of modern software delivery don’t tell the whole story. According to the LaunchDarkly AI Control Gap Report, 94% of engineering teams report shipping faster thanks to AI-assisted coding. Yet 91% are also more cautious about releasing changes to production. AI-assisted development tools, low-latency CI/CD pipelines, and platform abstractions have compressed the time between idea and production. But after those releases hit production, problems arise.
Moving fast has become easier for software teams, but managing code in production has become a greater challenge. Sustainable, controlled releases are what set top teams apart.
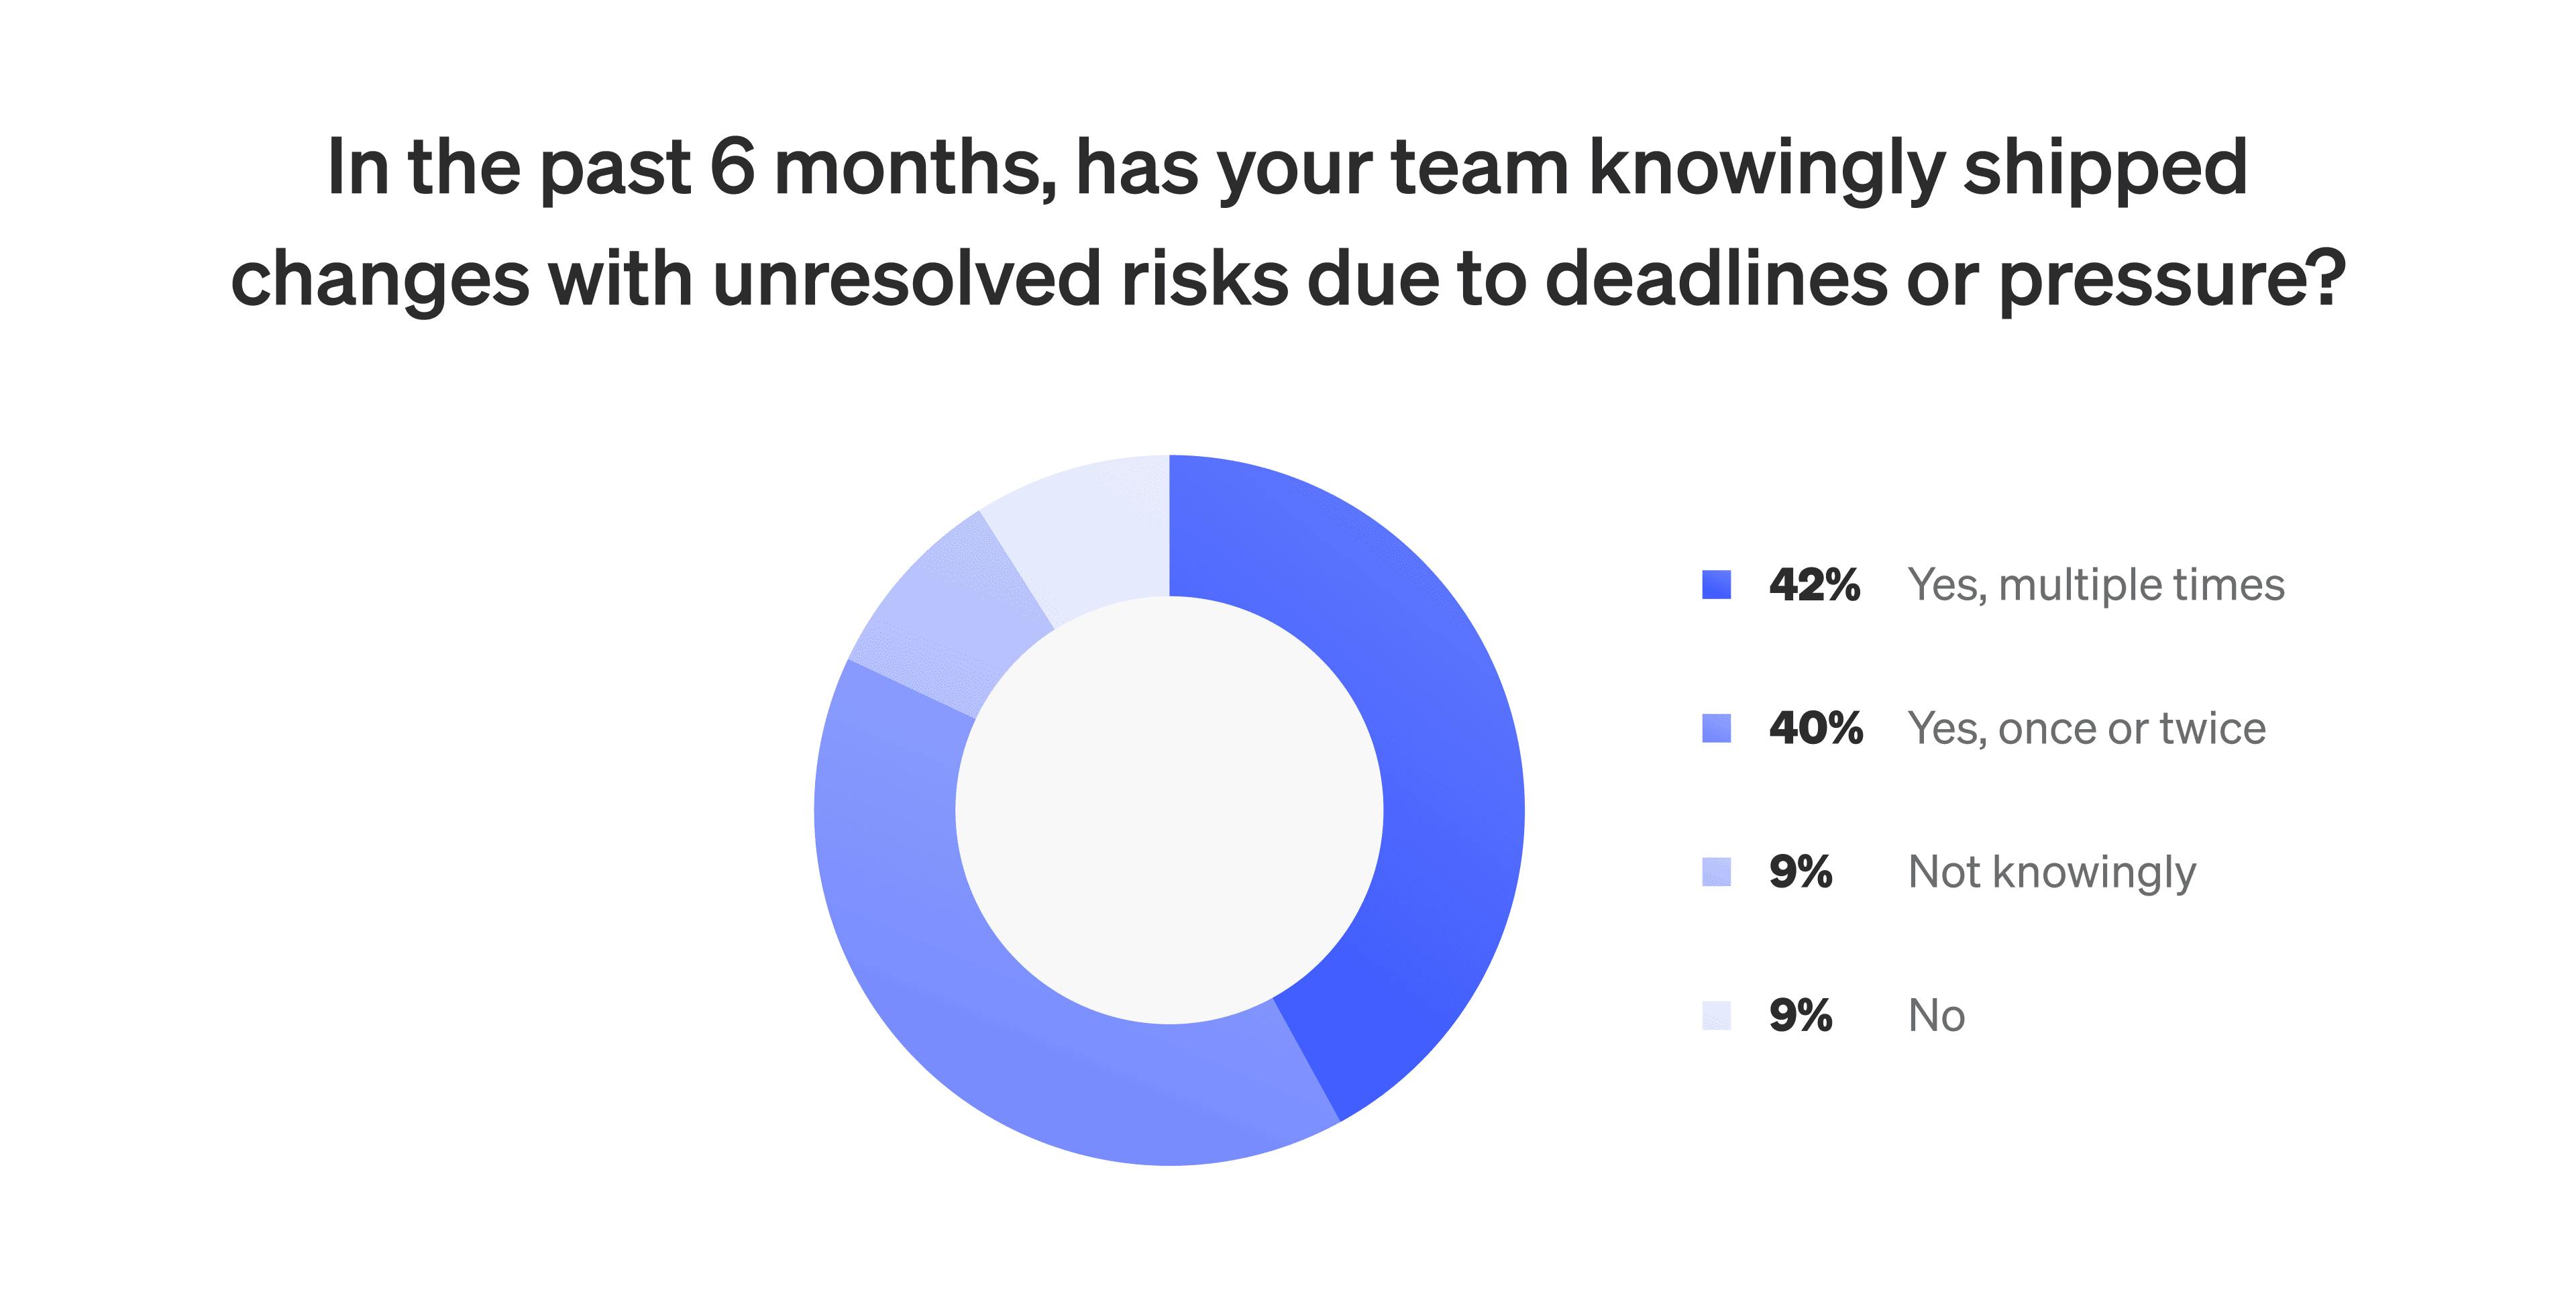
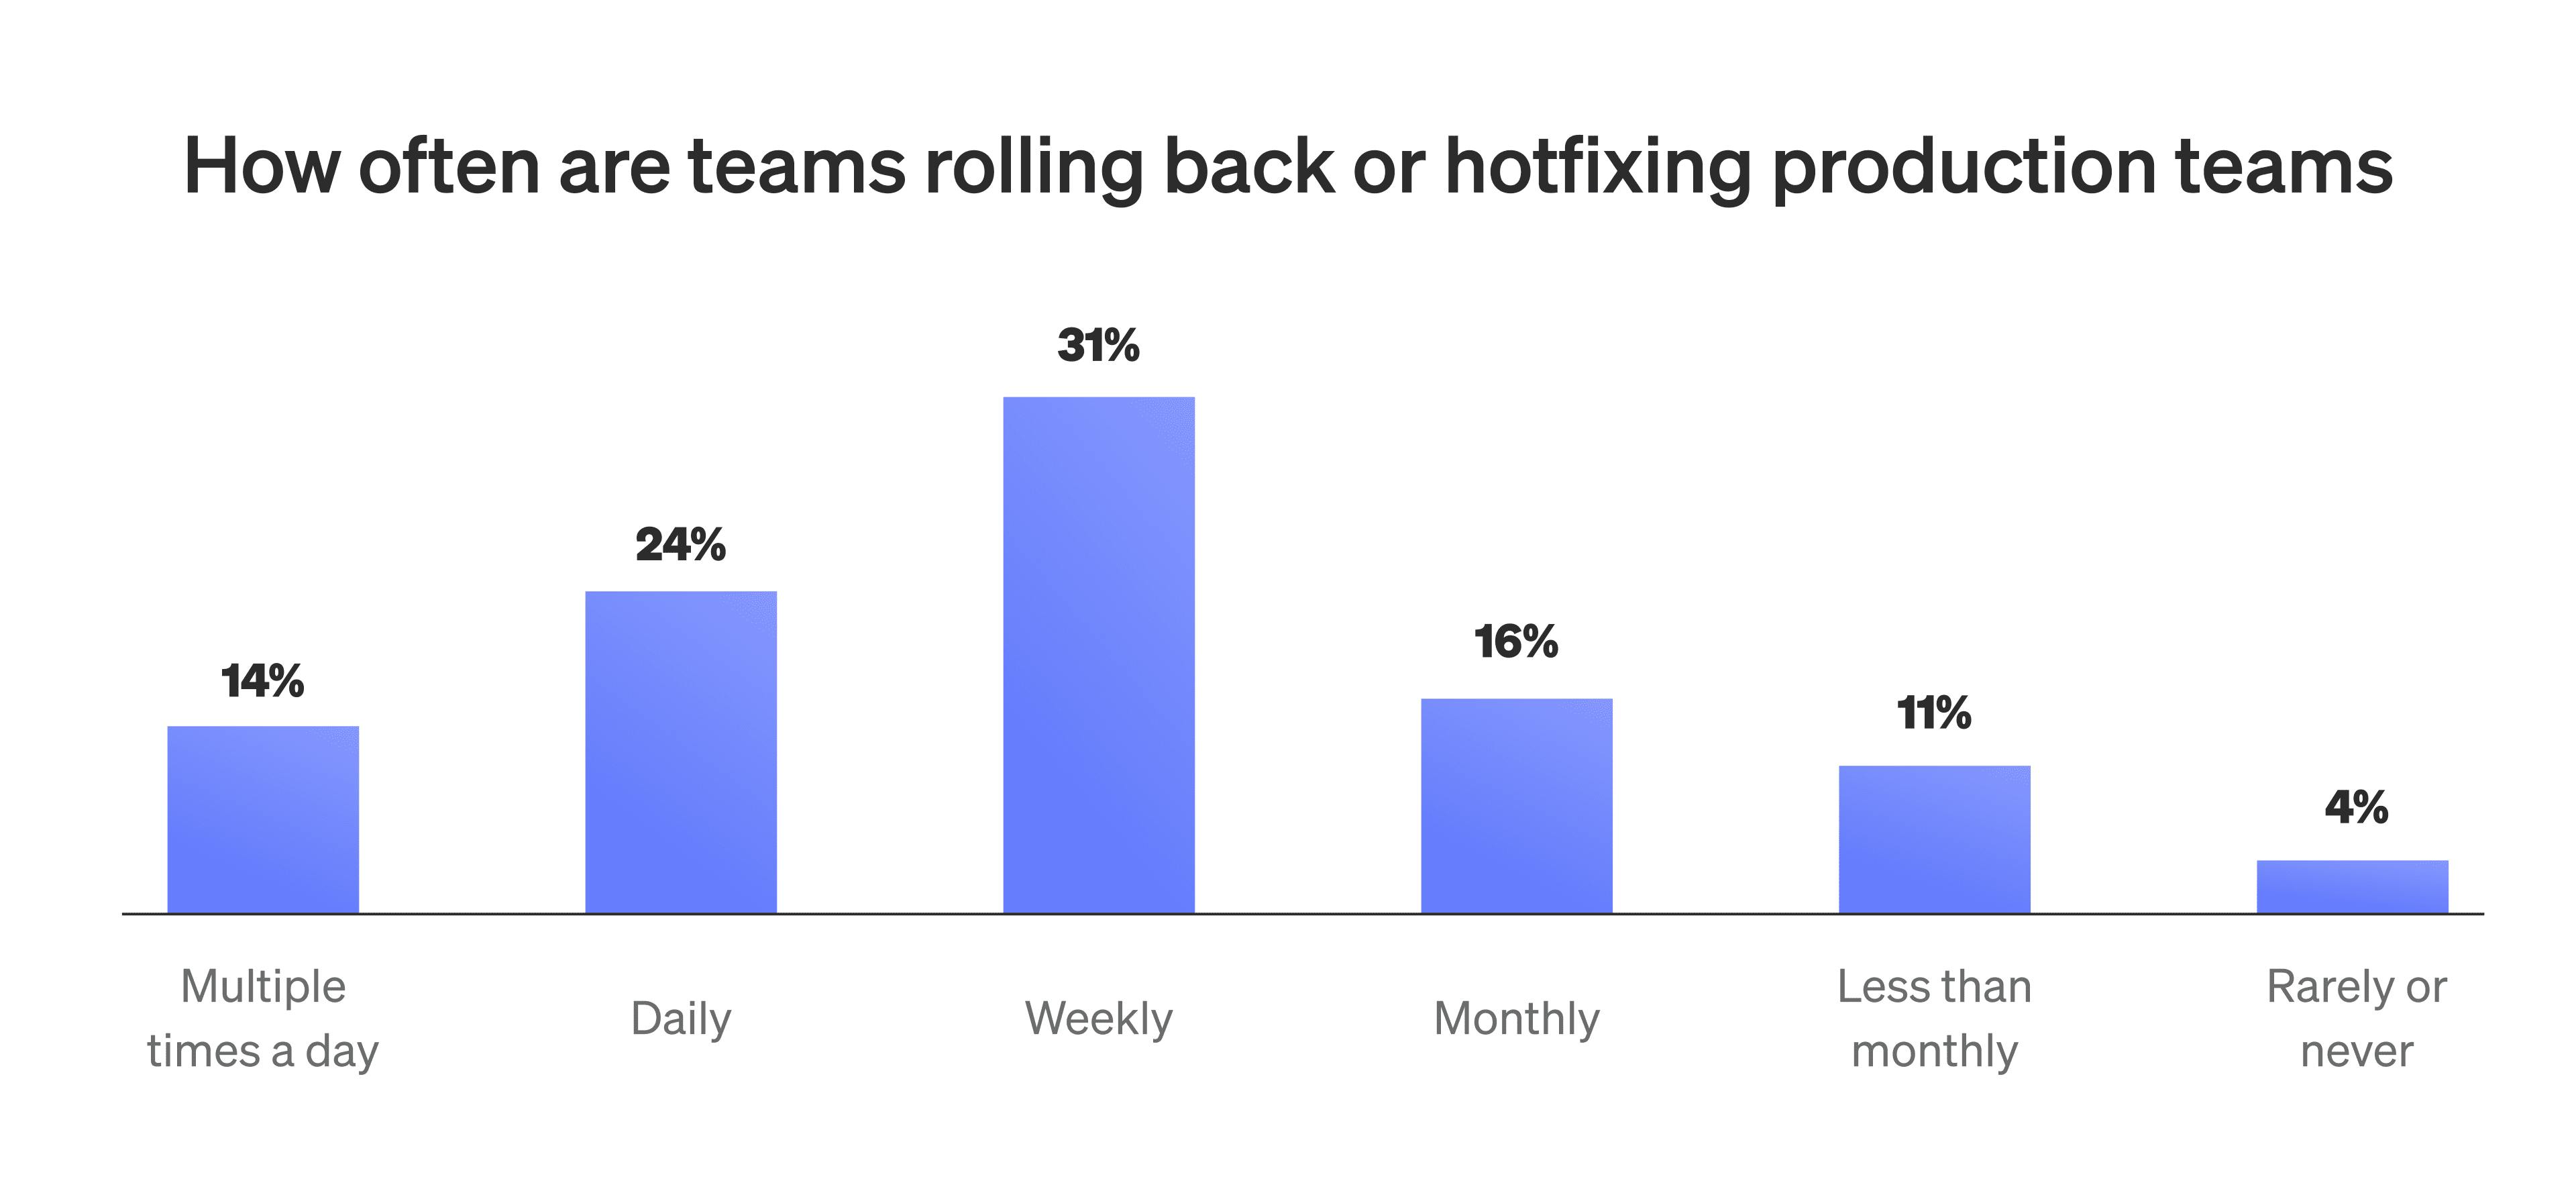
This creates a disconnect between standard delivery metrics and the actual success of releases. Teams may be shipping more often and reducing lead time, but those numbers don't reflect how often releases cause issues, require rollback, or demand manual intervention. Nearly 70% of teams still perform rollbacks or hotfixes weekly. More than 80% admit to knowingly shipping changes with unresolved risk due to delivery pressure.
These aren't “underperforming” teams. In many cases, they have feature flags, monitoring tools, and progressive delivery capabilities in place. But without consistent runtime control, those tools stay disconnected. The end result is that most metrics measure motion rather than progress.
High-performing teams measure more than speed
Teams that consistently release reliable software at scale focus on signals that reflect safety, autonomy, and real-time responsiveness. In addition to capturing how quickly code is released, their metrics also track the experience of working in production.
For example, a typical team might measure success by its number of deploys per week, while a high-performing team might track how many of those deploys required manual intervention. Instead of simply reporting MTTR, they may also look at MTTD—mean time to detect—and whether incidents were automatically mitigated before reaching customers.
A team measuring deployment frequency in isolation can miss the reliability context. A high-performing team would combine that number (deployment frequency) with the change failure rate to investigate whether frequent deploys are hiding downstream impacts.
They also look at how many releases occur without extra coordination. If a release required no meetings, no approvals, and no post-deploy babysitting, that’s a signal of maturity. These are quiet deployments: high-value, low-friction events that keep engineering teams focused on building.
The cost of not prioritizing control
Most teams are shipping more than ever, but that speed often reduces predictability. Testing cycles haven’t kept pace with the volume of AI-generated changes. Rollout strategies are inconsistent across teams. Observability exists, but it’s not tied to the state of the release or recent changes to it.
Under these conditions, even mature organizations fall into reactive patterns. Deployments go out fast, incidents follow, and support teams react under pressure. Engineering time then shifts from roadmap work to firefighting.
From the AI Control Gap Report:
- 77% of mid-sized orgs say AI-generated code is produced more quickly than they can govern it
- 80% of production incidents can take between 1 and 12 hours to resolve
- Fewer than 12% of teams can resolve incidents in under an hour
Typical workflows support fast development but fall short on runtime control. Without feature-level guardrails, release metrics capture only part of the picture.
What top teams are doing differently
Top-performing teams approach shipping code as an operational discipline. They treat releases like any other system in production: observable, measurable, and designed to handle failure.
High-performing teams separate deployment from release. Code is deployed automatically, but feature exposure is controlled at runtime. Flags determine which users see a change and allow teams to halt or reverse a release instantly without redeploying. Observability tools capture feature flag state alongside system metrics, helping teams link issues to specific code changes. With these systems in place, engineering metrics shift. Instead of tracking how quickly code reaches production, teams track how much effort it takes to keep a feature stable in production.
Some teams have started tracking the percentage of deployments that are fully automated from code merge to production exposure. Others look at how many flags have clear ownership and cleanup plans. These operational indicators provide a clearer signal of long-term release health.
Only 15% of teams surveyed met the benchmark of deploying daily while keeping incidents to a monthly cadence or less. Teams using LaunchDarkly were more than twice as likely to fall in that group.
How to measure release health
Delivery metrics need to reflect what happens after a deployment. That means paying attention to operational effort, risk signals, and team experience, including:
- how long it takes to recover from failed releases
- how often deployments require manual intervention
- how much engineering time goes toward incidents instead of feature work
- how frequently rollbacks happen and how much they affect users
- the number of flags that lack ownership or remain active long after they’re needed
Some teams monitor “mean time to verify” to measure how long it takes them to feel confident that a feature is working as intended post-release. Others view “zero-touch release percentage” as a goal: deployments that require no human follow-up or mitigation. These metrics are better for capturing the system's maturity at the time of the release.
These indicators help expose hidden friction. They show where process debt accumulates and where systems need reinforcement. Most importantly, they give engineering leaders a way to demonstrate effectiveness without relying solely on velocity.
Top teams stay in control at runtime
Top engineering teams move quickly and maintain control over what gets released. They treat release systems like critical infrastructure: designed to be reliable, observable, and maintainable.
With a runtime control plane, teams can plan feature rollouts, adjust who sees what in real time, and turn off features immediately if something goes wrong. They also get a clear view of which features were active during an incident, making it easier to diagnose and resolve issues.
This approach gives teams better visibility into how code behaves in production. They can track release reliability, understand how often problems occur, and measure how quickly they respond. The metrics they care about are directly supported by the way they ship.
The best teams don’t just ship fast; they measure what matters and stay in control. Learn more in the AI Control Gap Report.