 The **Services** entry in the dashboard list is not a graph-based dashboard. It displays the services LaunchDarkly discovers in your traces data, either as a dependency map or a list. Each service provides a link to review details for the service. To learn more, read [Services](/docs/home/observability/services).
## Default dashboards
Default dashboards provide out-of-the-box observability for your applications without any configuration. To access default dashboards, navigate to **Observability > Dashboards** in the LaunchDarkly UI. The default dashboards will appear automatically once you have the required integrations configured and data is flowing.
There are three default dashboards available:
### Frontend default dashboard
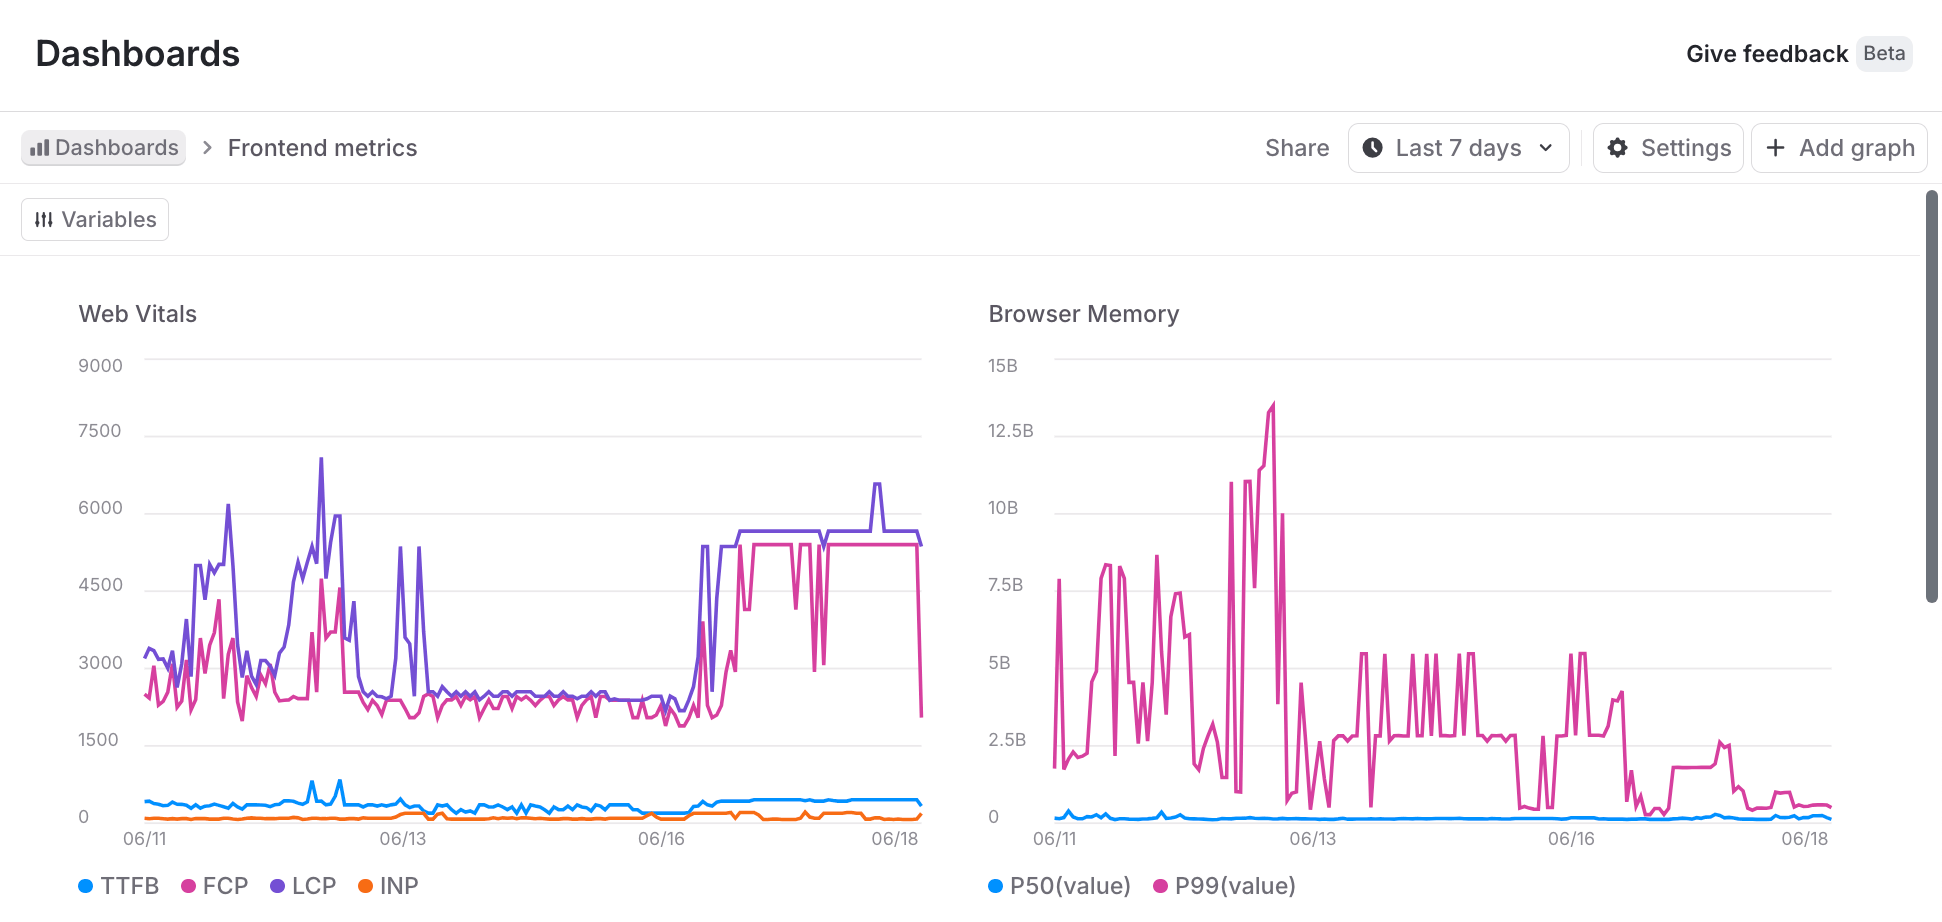
The frontend default dashboard monitors client-side application performance and user experience metrics. This dashboard includes three tabs:
The **Services** entry in the dashboard list is not a graph-based dashboard. It displays the services LaunchDarkly discovers in your traces data, either as a dependency map or a list. Each service provides a link to review details for the service. To learn more, read [Services](/docs/home/observability/services).
## Default dashboards
Default dashboards provide out-of-the-box observability for your applications without any configuration. To access default dashboards, navigate to **Observability > Dashboards** in the LaunchDarkly UI. The default dashboards will appear automatically once you have the required integrations configured and data is flowing.
There are three default dashboards available:
### Frontend default dashboard
The frontend default dashboard monitors client-side application performance and user experience metrics. This dashboard includes three tabs:
| Tab | Required Integration | Documentation |
|---|---|---|
| Overview | JS Observability Plugin + JS Session Replay Plugin | JavaScript Observability SDK |
| Web Vitals | JS Observability Plugin | JavaScript Observability SDK |
| Resources | JS Observability Plugin | JavaScript Observability SDK |
| Tab | Required Integration | Documentation |
|---|---|---|
| Overview |
Server-side SDK with traces OR OpenTelemetry with span\_kind=Server attribute
|
Observability SDKs |
| Queries |
Server-side SDK with database instrumentation OR OpenTelemetry traces with span\_kind=Client and{' '}
db.system attributes
|
Observability SDKs or{' '} OpenTelemetry server-side |
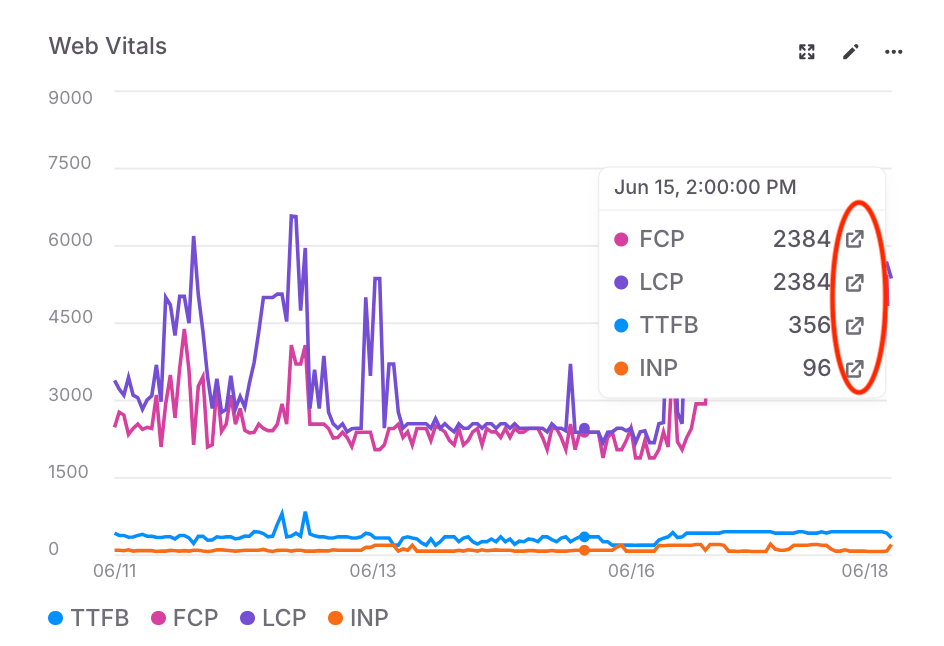 5. Click any of the details links to open a panel with the relevant sessions, errors, logs, or traces. The data points in the panel are filtered using the graph's filters and the grouping, time range, or metric bucket for the specific data point that you selected.
From the detail panel, you can:
* Search the underlying data using the [search specification](/docs/home/observability/search) for the LaunchDarkly observability features.
* Click **Copy link** and share the data with other members of your organization.
* Click a data row to review additional details.
## Viewing flag targeting changes
You can overlay flag targeting changes on dashboard charts to correlate feature flag updates with changes in your application metrics. This is available on both default and [custom dashboards](/docs/home/observability/custom-dashboards).
To view flag targeting changes, select one or more flags using the **Flags** dropdown in the dashboard filter bar. Then select one or more environments using the **Environments** dropdown.
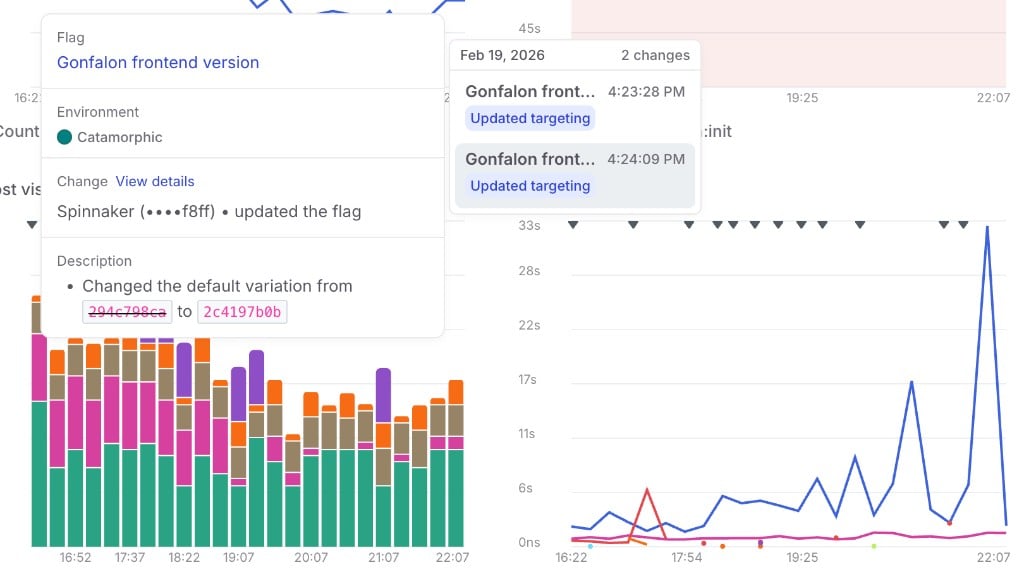
When enabled, markers appear on the time axis of each chart at the timestamp of each flat targeting change. If a flag has progressive rollout steps, the steps are connected with a line.
Hovering over a marker displays a tooltip with details about the change. Click **View details** in the tooltip to open the flag's targeting history.
5. Click any of the details links to open a panel with the relevant sessions, errors, logs, or traces. The data points in the panel are filtered using the graph's filters and the grouping, time range, or metric bucket for the specific data point that you selected.
From the detail panel, you can:
* Search the underlying data using the [search specification](/docs/home/observability/search) for the LaunchDarkly observability features.
* Click **Copy link** and share the data with other members of your organization.
* Click a data row to review additional details.
## Viewing flag targeting changes
You can overlay flag targeting changes on dashboard charts to correlate feature flag updates with changes in your application metrics. This is available on both default and [custom dashboards](/docs/home/observability/custom-dashboards).
To view flag targeting changes, select one or more flags using the **Flags** dropdown in the dashboard filter bar. Then select one or more environments using the **Environments** dropdown.
When enabled, markers appear on the time axis of each chart at the timestamp of each flat targeting change. If a flag has progressive rollout steps, the steps are connected with a line.
Hovering over a marker displays a tooltip with details about the change. Click **View details** in the tooltip to open the flag's targeting history.