

Why Use Chrome DevTools
With the toolkit being embedded in the browser, Chrome DevTools provides developers with powerful and efficient tools which can be used to inspect and edit code without switching tabs. The Chrome DevTools provides developers with simulations that enable them to see the performance of their website across different devices and browsers. This is extremely useful for fixing potential problems and optimizing the website for all users. The device mode tests across various devices, and the browser mode tests across various browsers. It also allows developers to measure page performance, analyze network activity, and track down memory leaks. In short, Chrome DevTools is an indispensable tool for any web developer. While it may seem daunting at first, the Chrome DevTools documentation is actually quite helpful. And once you get the hang of it, you’ll wonder how you ever developed without it.How to Open Chrome DevTools
To open the Chrome DevTools by pressOption + ⌘ + J (Mac) or CTRL + SHIFT + J,(Windows, Linux).
Once the DevTools are open, you should see a panel that looks like this:
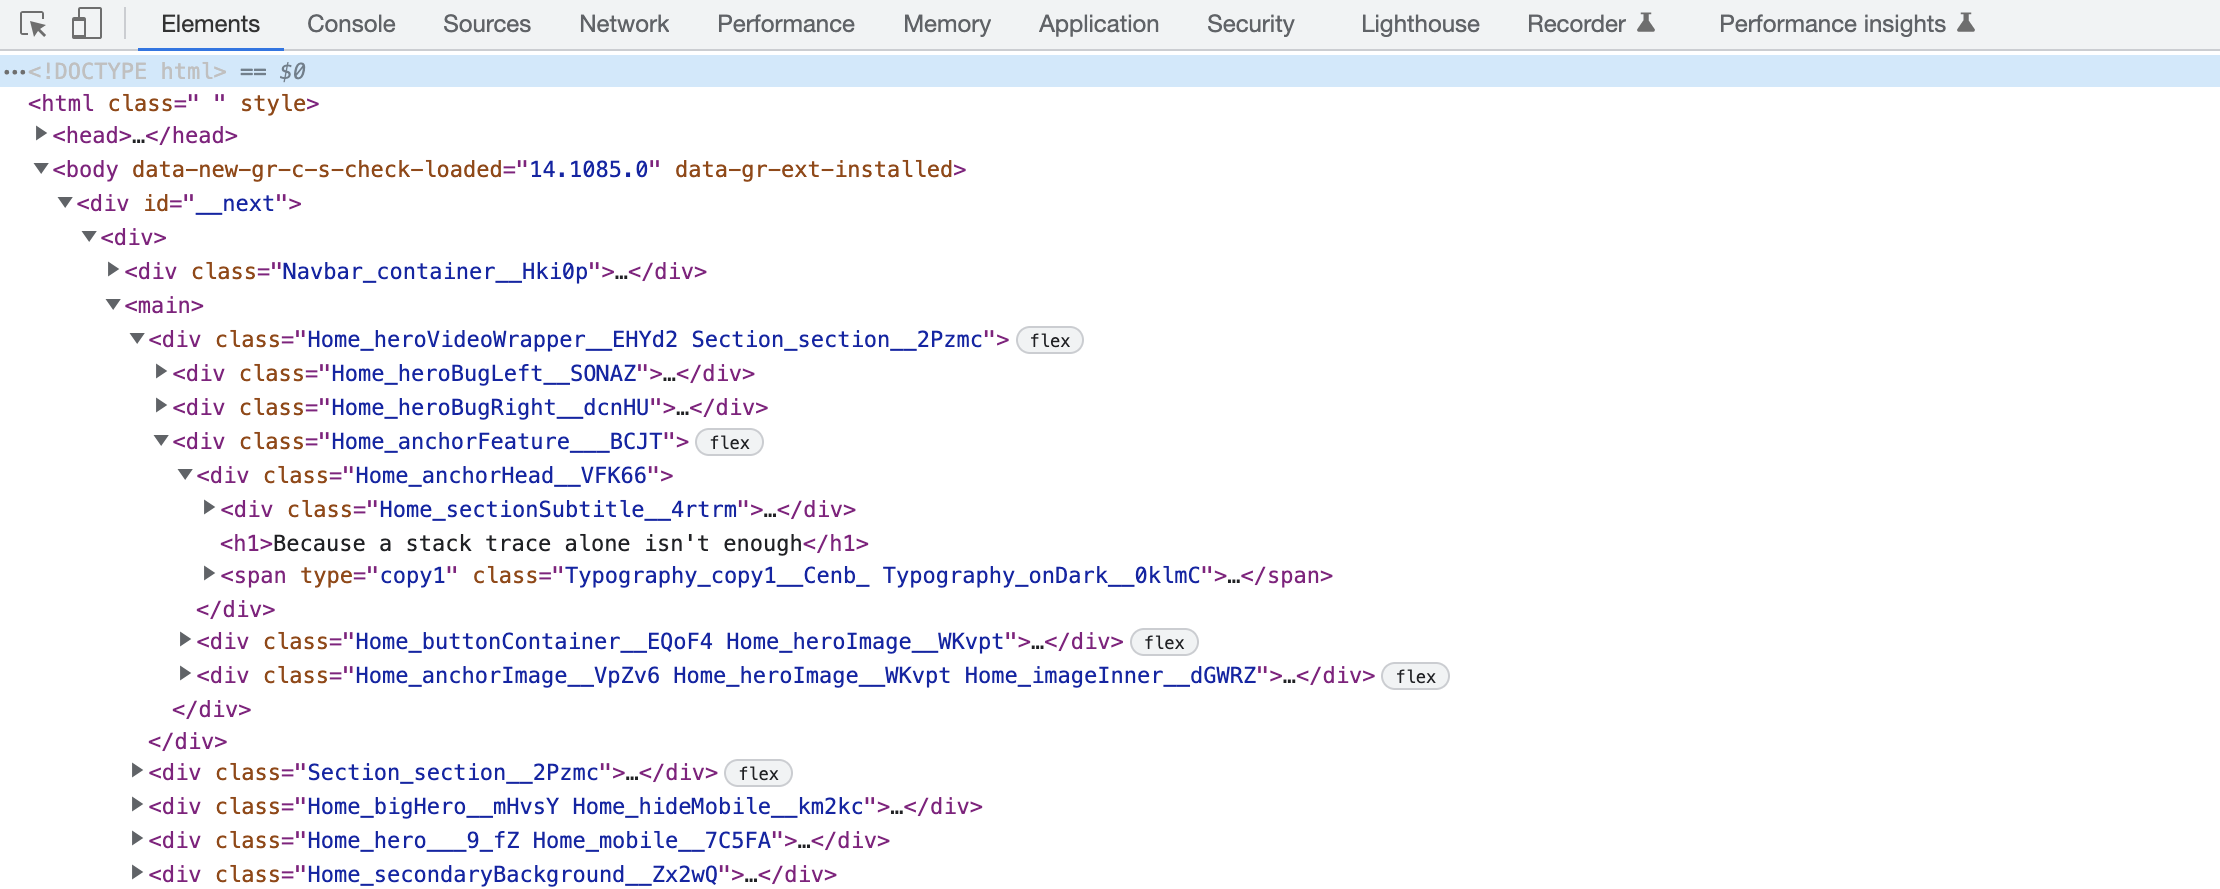
Chrome DevTools panel after opening it with the keyboard shortcut.
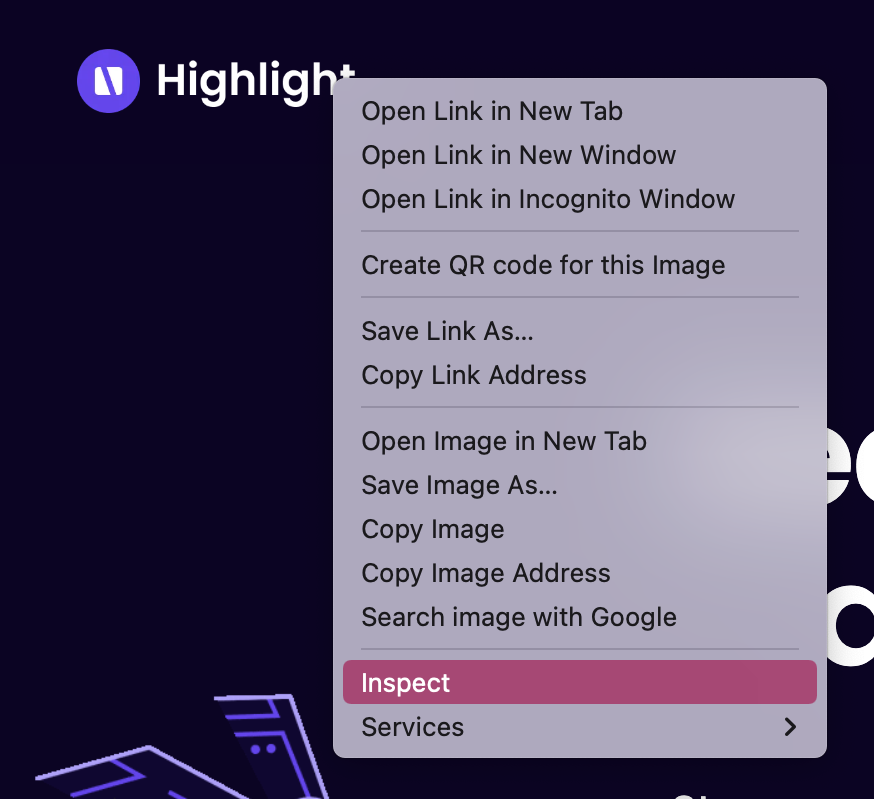
Right-click context menu showing the Inspect option to open Chrome DevTools.
- Element
- Console
- Sources
- Network
- Performance
- Memory
- Application
- Security
- Lighthouse
- Recorder
- Performance insights
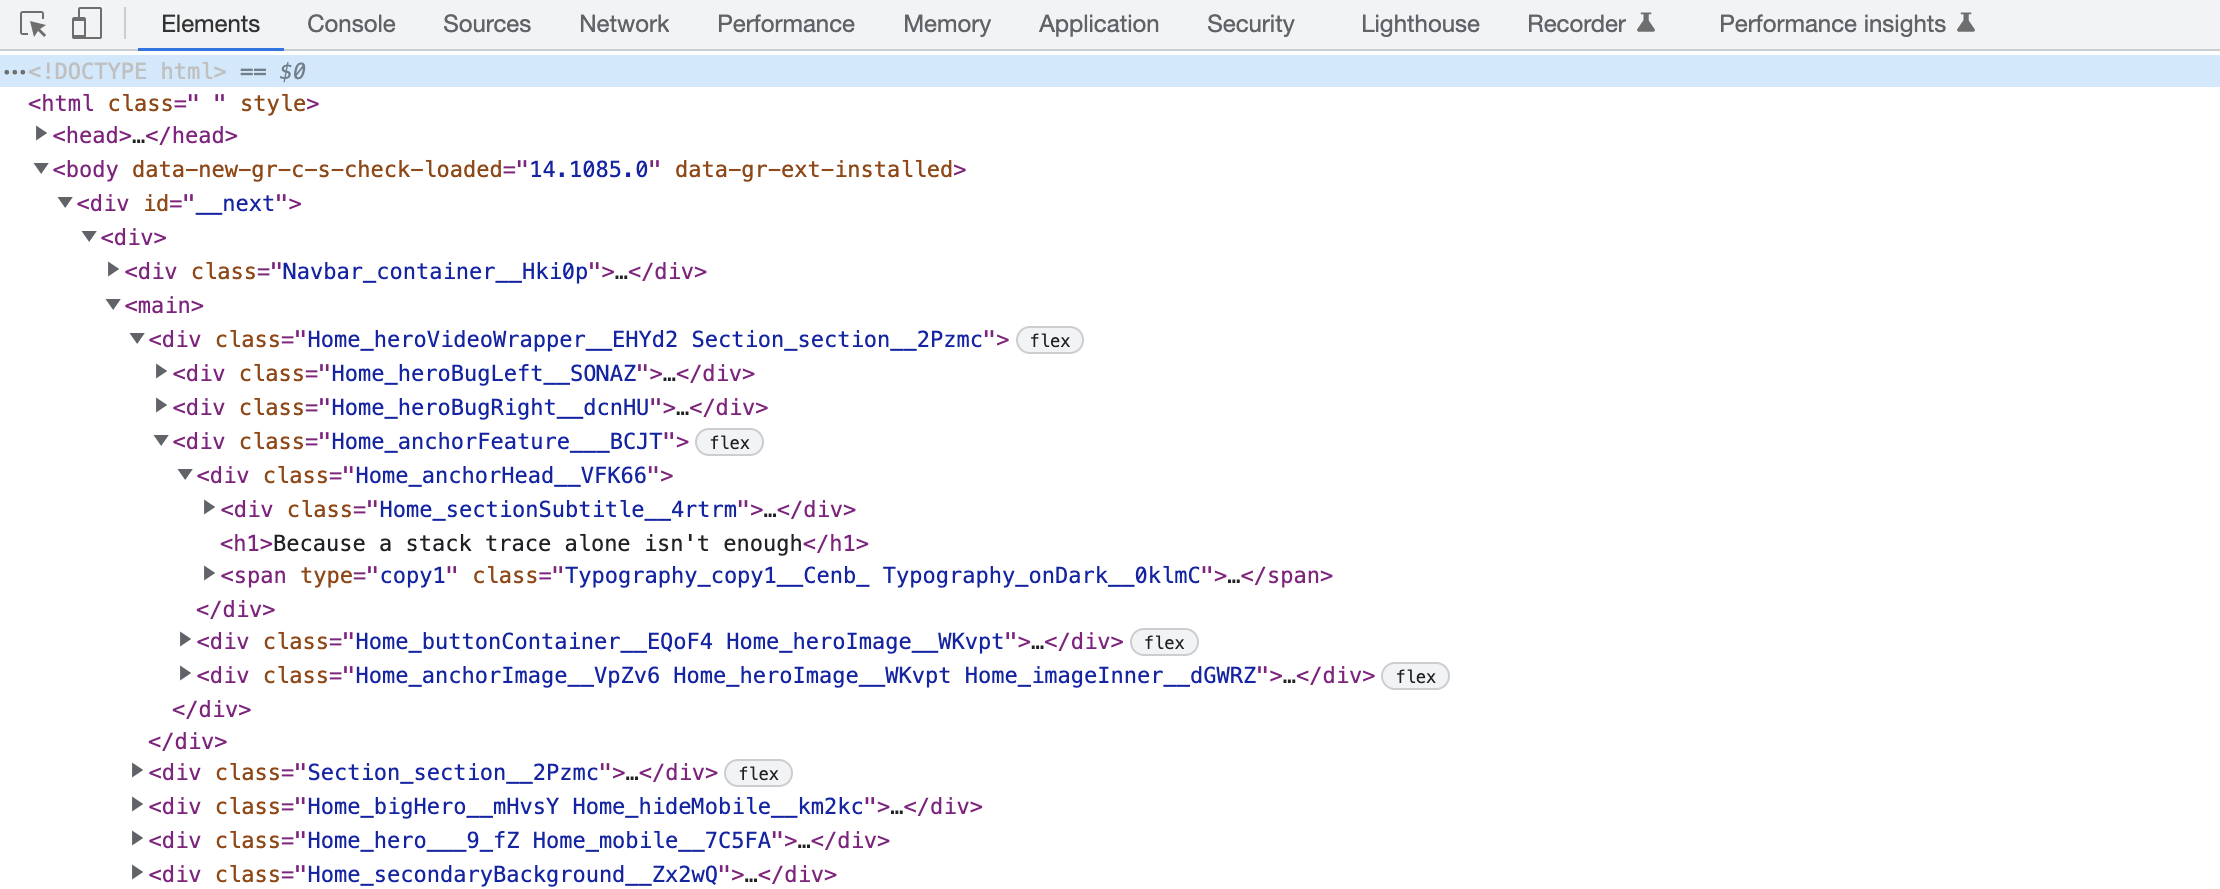
Chrome DevTools showing all available tabs including Elements, Console, Sources, Network, and more.
- Elements
- Console
- Sources
- Network
- Application
The Chrome DevTools Tabs
Elements
The Elements panel is where you’ll do most of your work in the DevTools. This is where you can inspect and edit the HTML and inline CSS of the web page to inspect or edit. You can make changes to your code either temporarily or permanently and see the changes implemented immediately.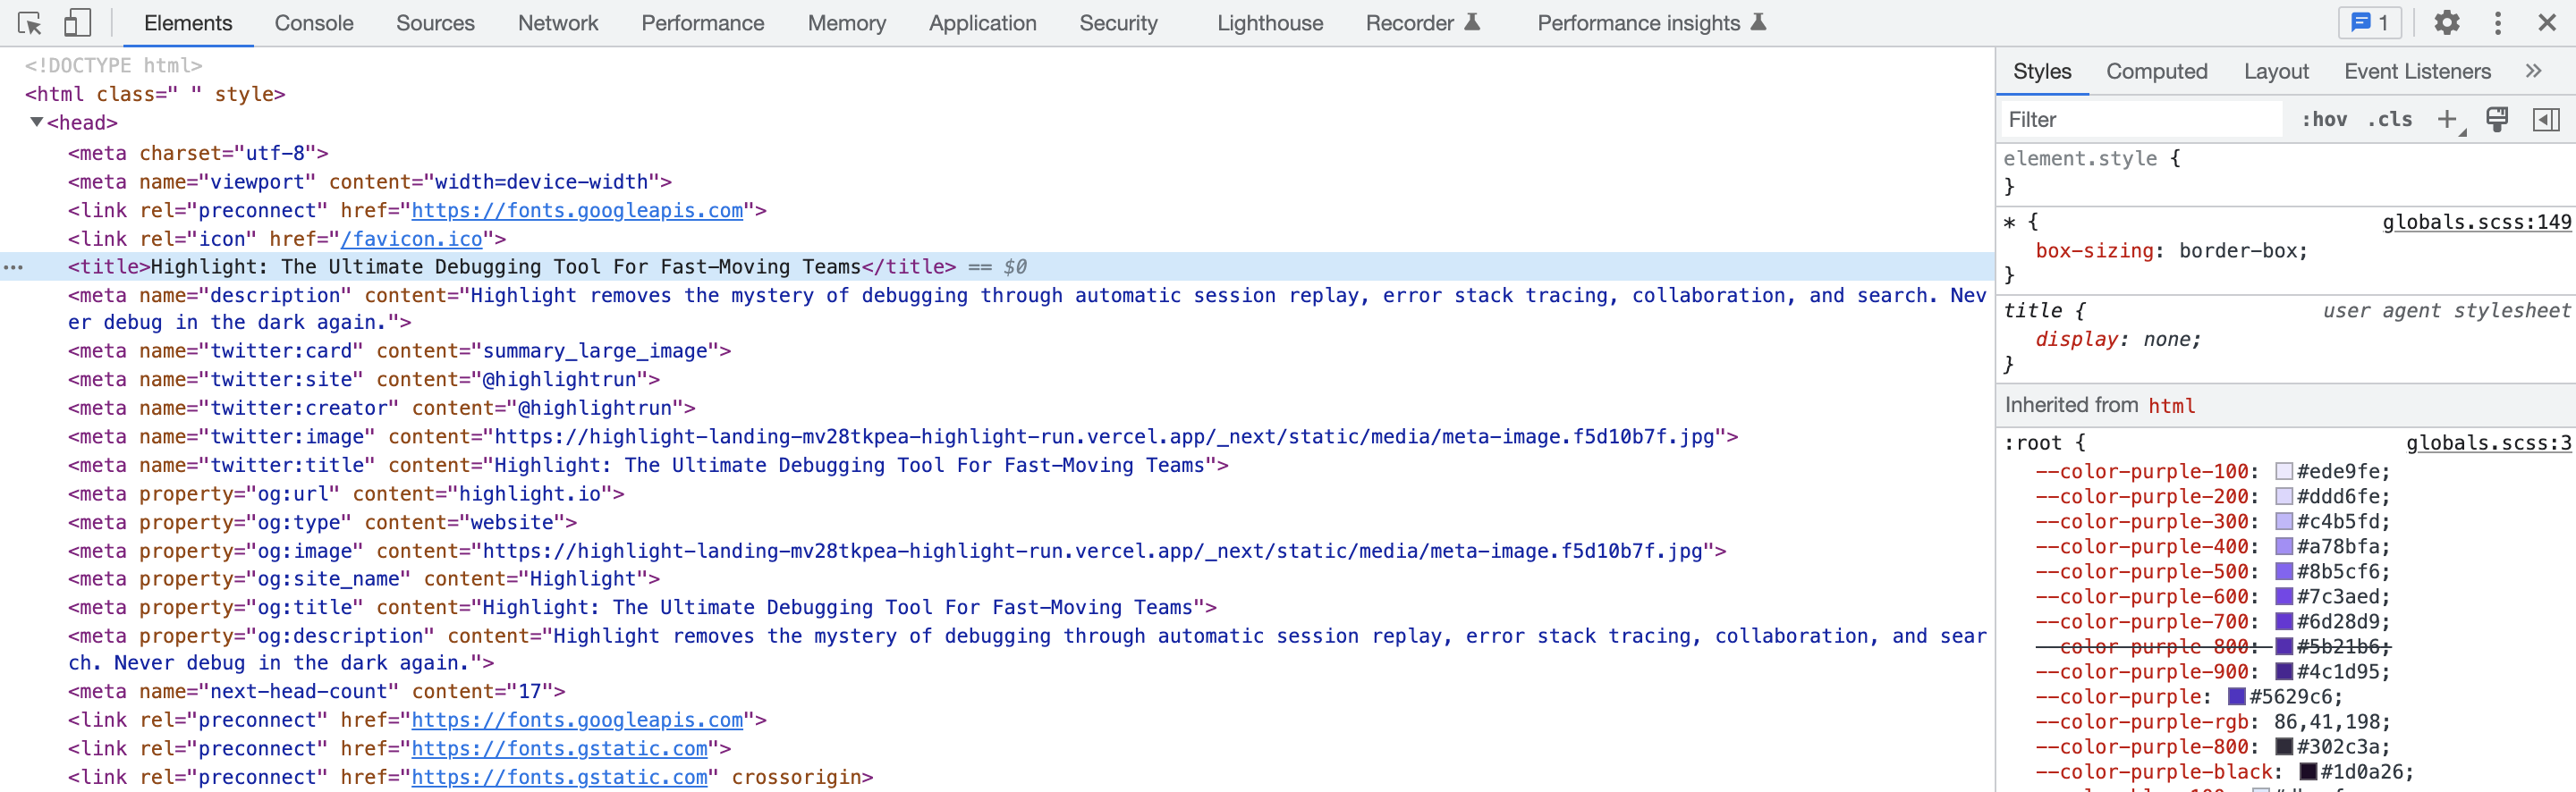
The Elements panel in Chrome DevTools for inspecting and editing HTML and CSS.
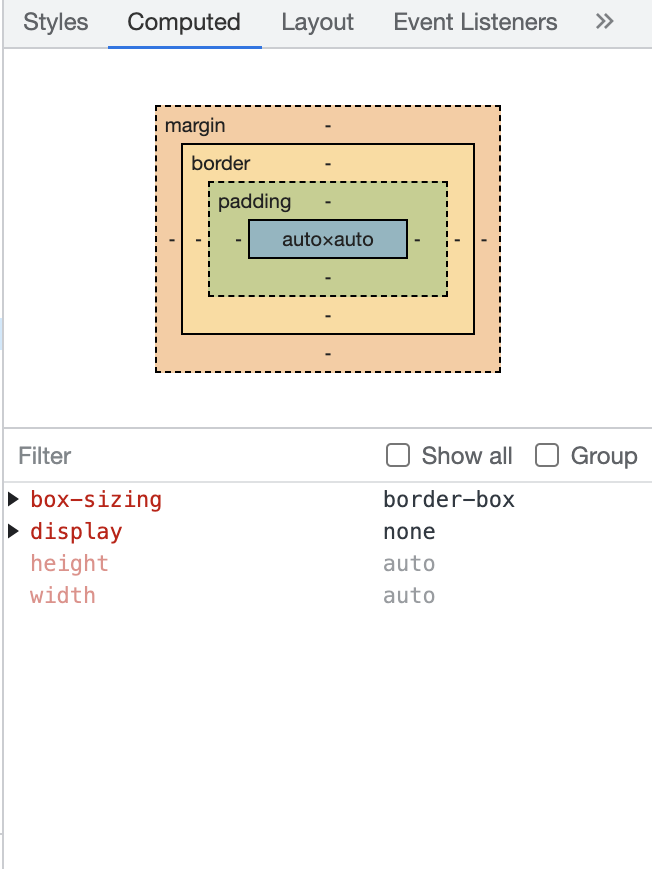
The Computed pane in Chrome DevTools showing applied CSS properties and box model sizing.
Console
The console tab is a powerful tool that every JavaScript programmer should be aware of. It basically supplies information about the interactive elements on your web page while allowing you to interact with the web page by writing JavaScript. The console tab allows you to interact with your web page in real time, run, debug, and even test code snippets. To debug with the console tab, you need to input a debugger into your code, refresh the page and create an event. Once you have done this, you will be redirected to the debugger console. The console tab is particularly useful for debugging, as it allows you to spot bugs or issues much faster than if you were testing in your actual JS file. If the code is now working according to what is expected with no issues, you can go ahead to copy it and put it into your actual JS file to make your changes permanent.
The Console tab in Chrome DevTools used for running and debugging JavaScript code.
Sources
The Sources tab allows you to view and edit both the CSS and JavaScript code of your page. To use it, simply select a file, and the contents will open up in the Editor pane. From there, you can make changes to your code and see them implemented in real time. The pages button at the top will show you what file you are currently inspecting. One handy feature of the Sources tab is the ‘Filesystem’ button at the top, which lets you connect your file directly from your code editor to Chrome DevTools. This can be useful when you are confident about the changes you want to make, as it means that any change made in DevTools will automatically be saved in the source file. However, it is essential to note that by default, any changes made in DevTools will not be reflected in your source code unless you connect your code editor to DevTools as well. So if you want to make sure that your changes are saved, be sure to use this feature. Otherwise, your changes will be lost when you refresh the page.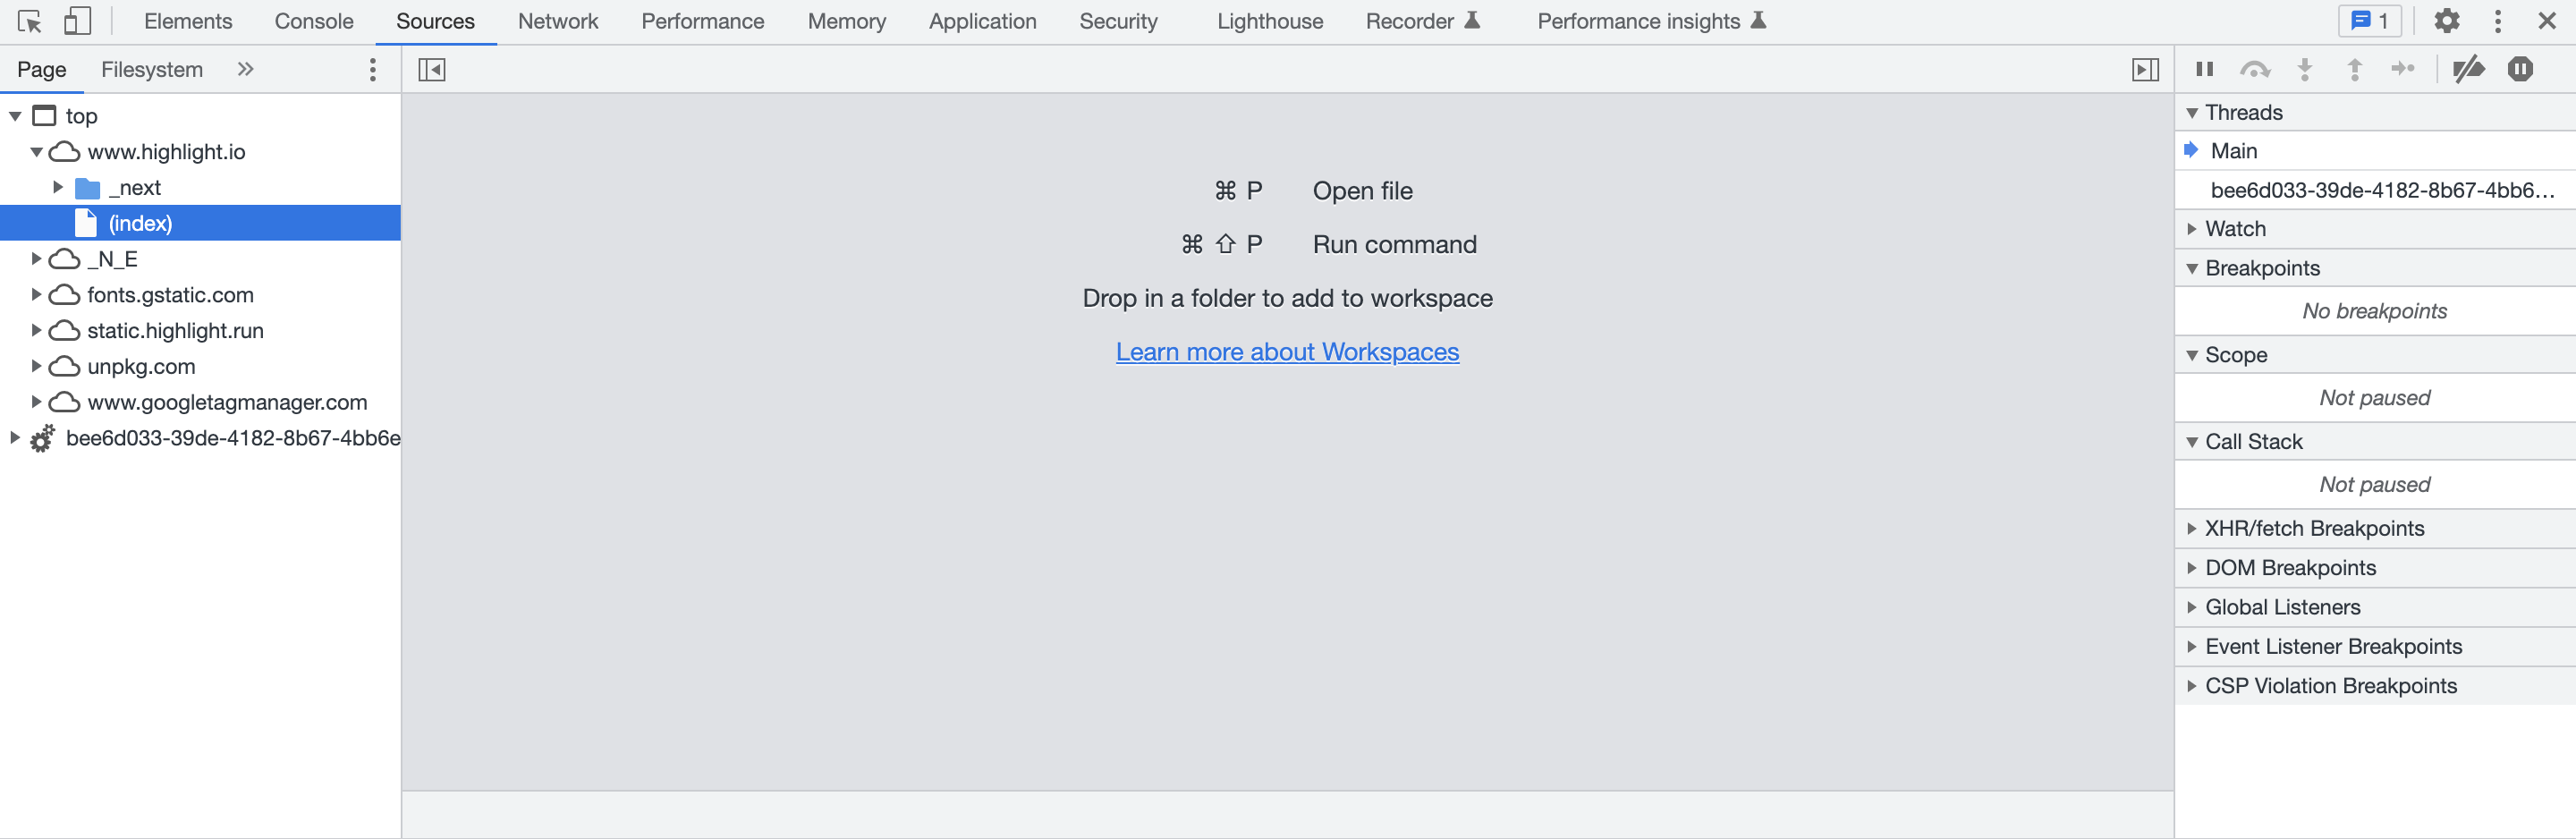
The Sources tab in Chrome DevTools for viewing and editing CSS and JavaScript files.
Network
The Network tab is a powerful tool that can help you identify and diagnose loading issues on your web page. By selecting a resource, you can see detailed information about that resource, including the type of resource, when it was loaded, and how long it took to load.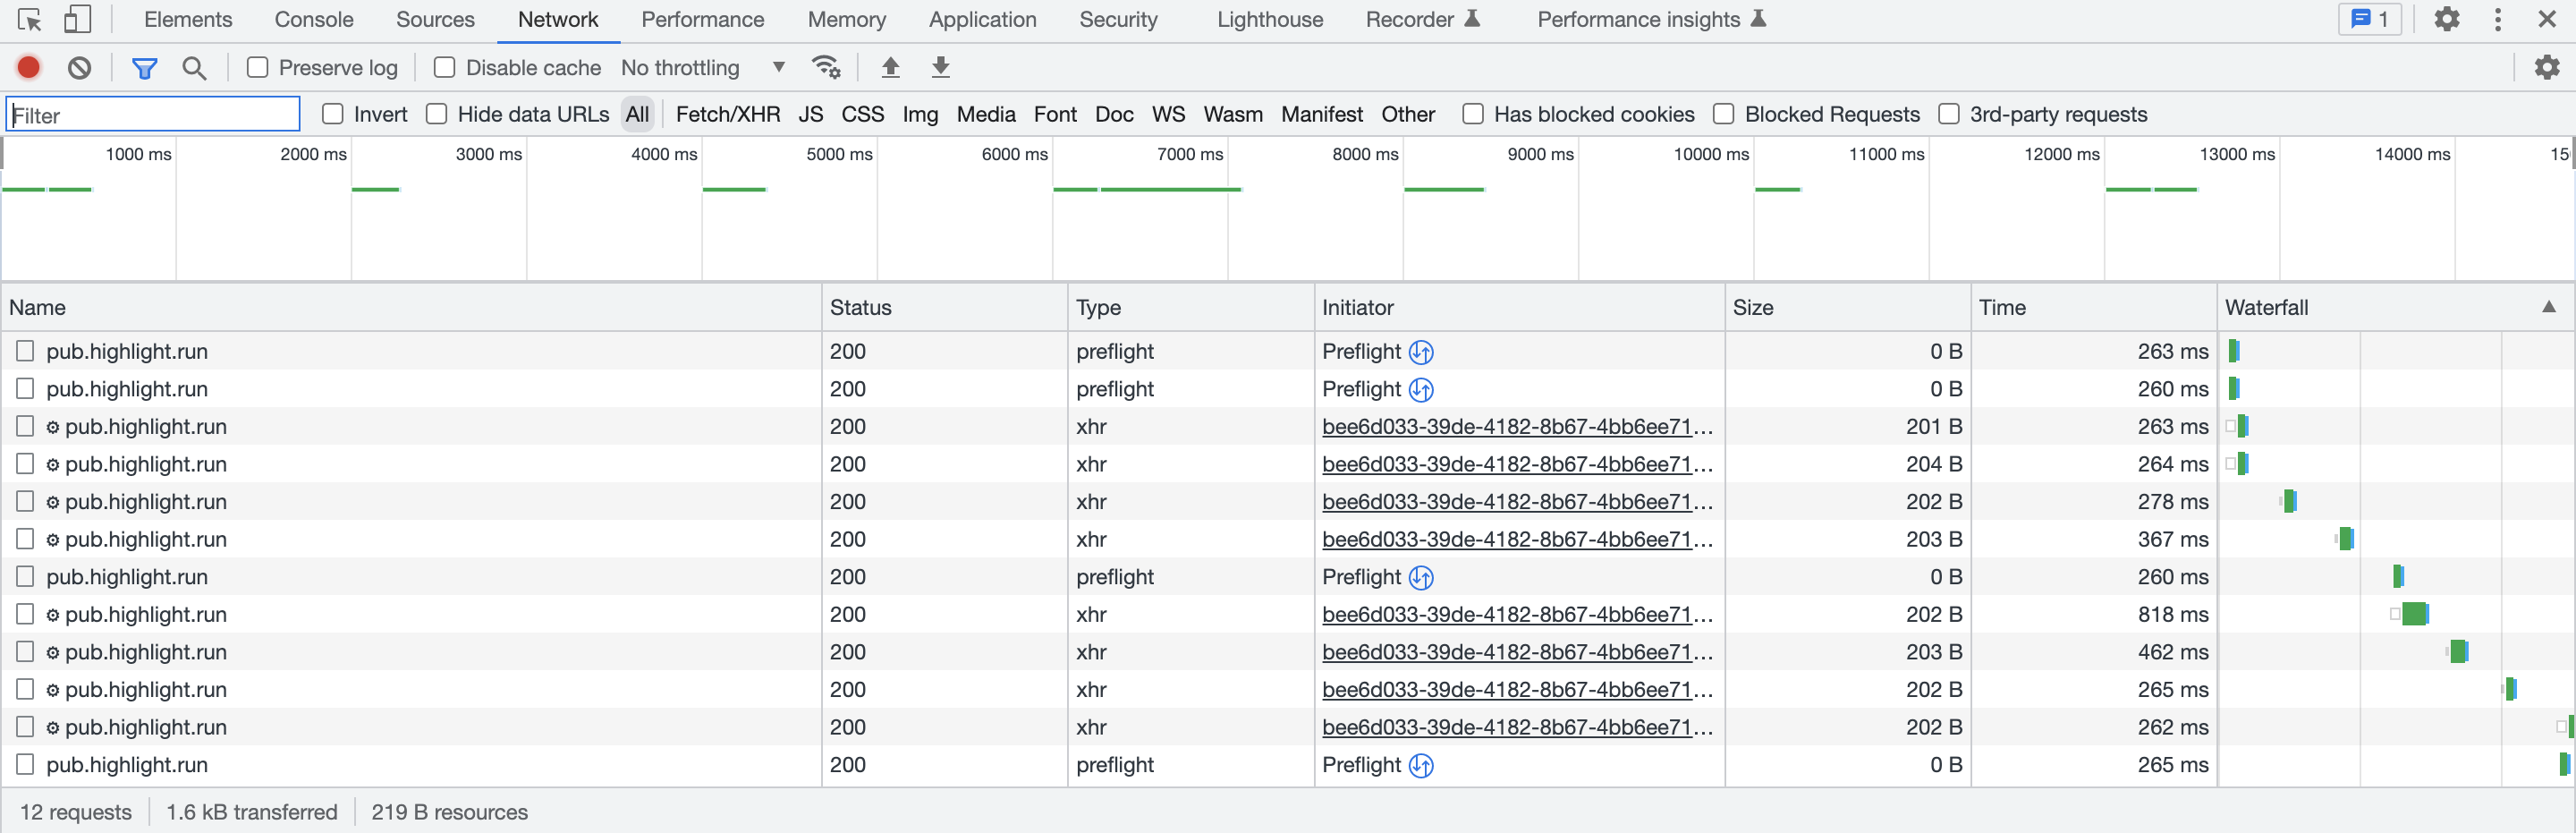
The Network tab in Chrome DevTools showing resource loading details and timing information.
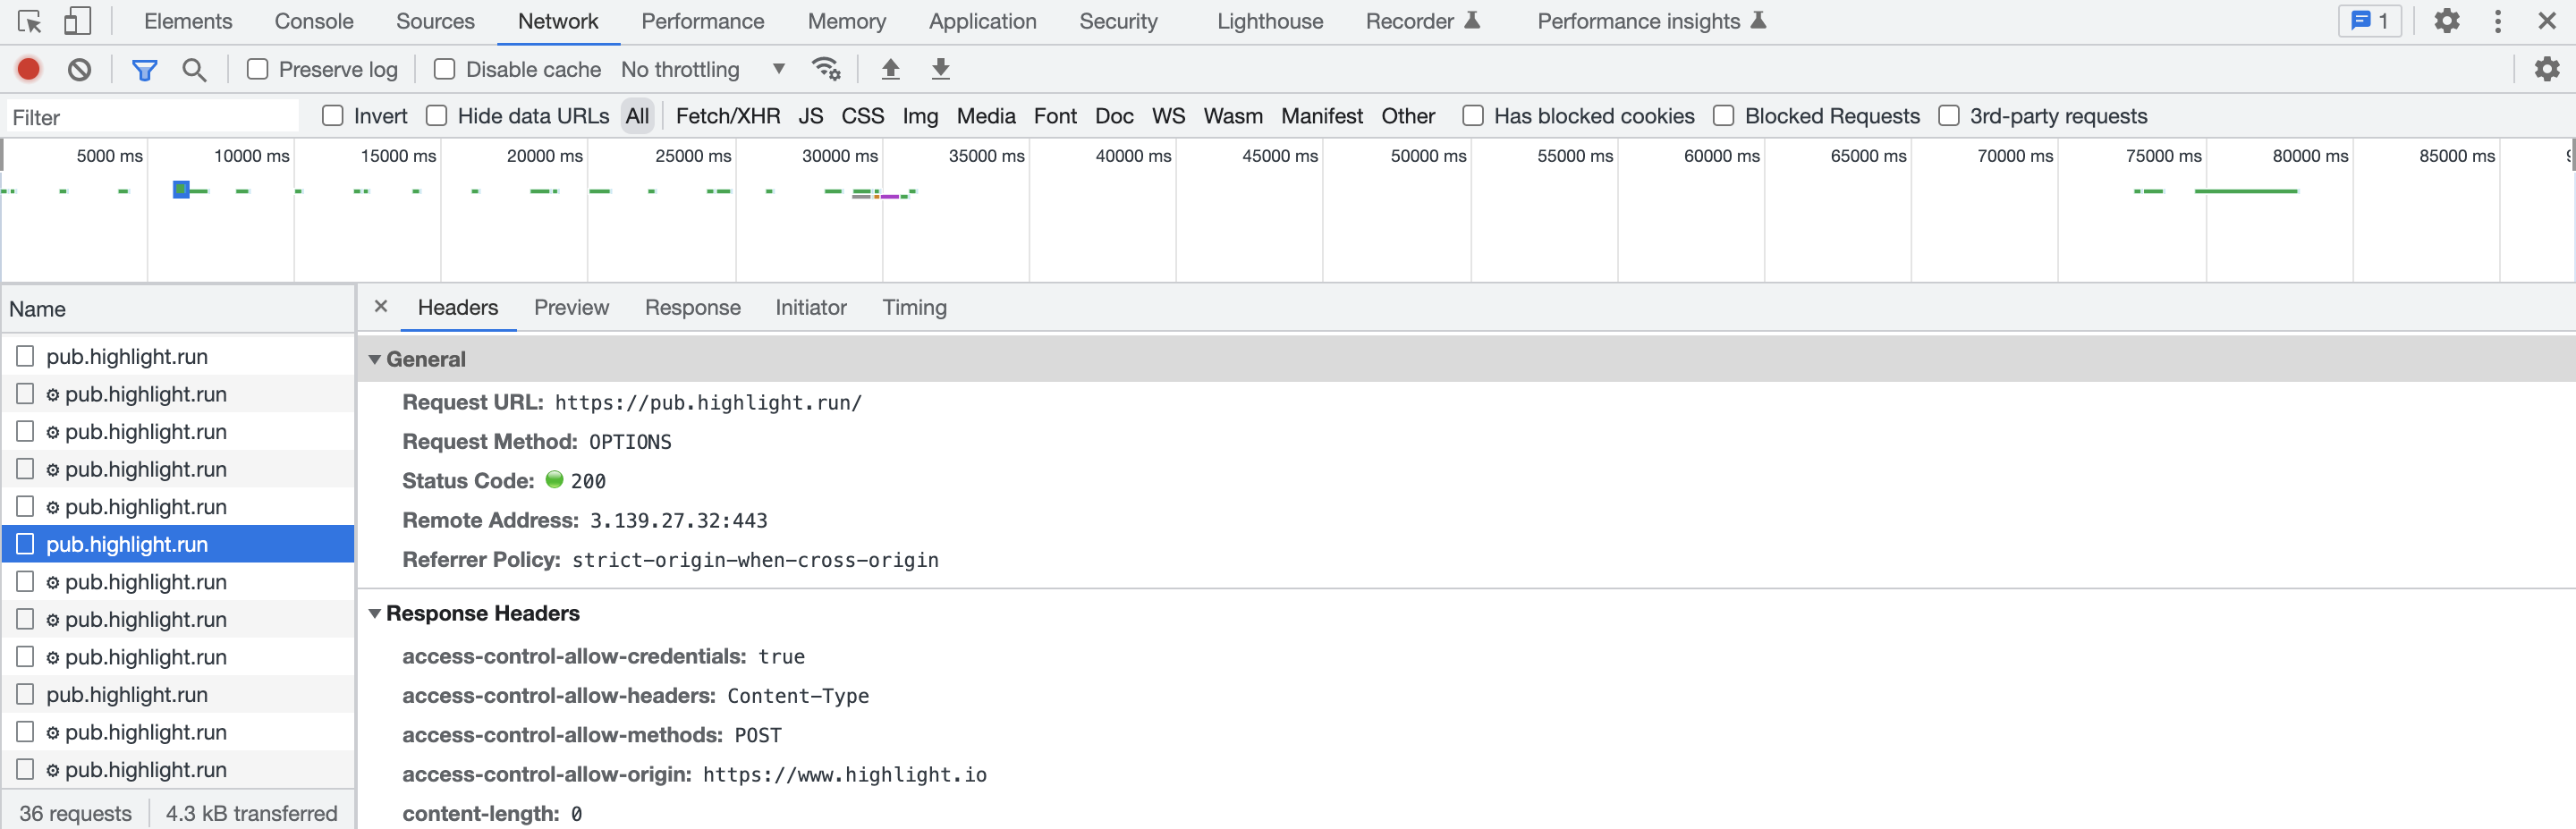
The Network tab displaying detailed load information for the current URL.
Application
The Application tab is a really handy tool that allows you to see what resources are being used by your web application, clear any web app data that you don’t need, and ensure it’s healthy. To use the Application tab, simply select a resource under the Resources pane. This will bring up the storage details of that resource. If you need to clear any web app data, you can do so by selecting the ‘Clear storage’ option from the menu. This includes cache, cookies, local storage, and anything else that makes up the data of your web application.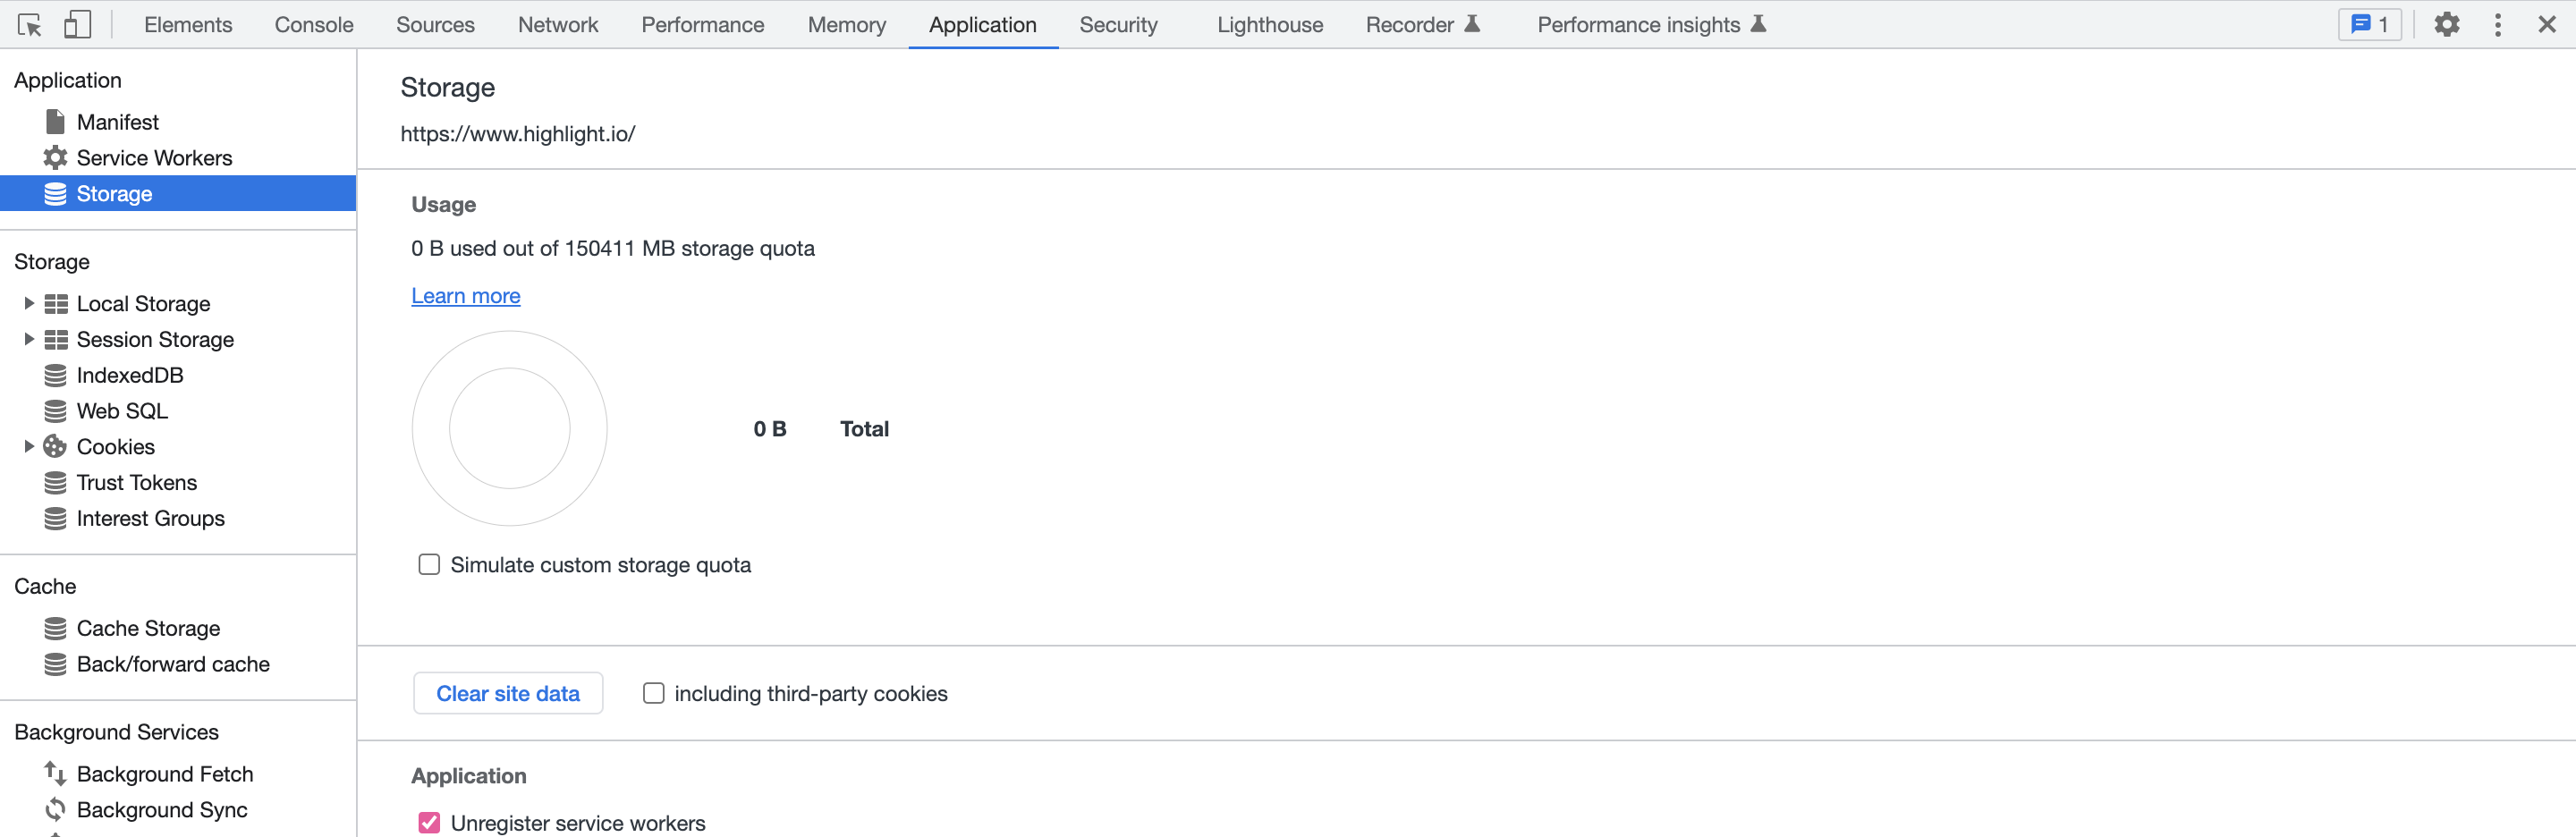
The Application tab in Chrome DevTools showing storage, cache, and web app data resources.