
Metric exemplars
LaunchDarkly observability features are publicly available in early access. Enable observability in the billing page.
This topic explains how to use metric exemplars to connect points on an observability metric graph to the traces and sessions that produced them.
About metric exemplars
Whereas each point on a metric graph is an aggregate value, an exemplar is a reference to an individual metric measurement that contributed to the aggregate. The exemplar combines a point-in-time measurement with the OpenTelemetry trace or session that recorded it. Displaying exemplars on a graph helps you navigate from an anomalous aggregate value to the specific span or session replay that caused the anomaly, without building a separate query.
LaunchDarkly stores two kinds of exemplar references:
- Trace exemplars come from OpenTelemetry exemplar sampling. They reference a trace and the span that was active when your application recorded the metric measurement.
- Session exemplars come from browser, Android, and React Native metrics. They reference the session that was in progress when your application recorded the measurement. Producing them requires session replay in addition to observability, because session replay is what creates the session that the exemplar opens.
Some metrics carry both kinds of reference, and some carry neither. LaunchDarkly automatically attaches whichever references are available when it ingests the metric. How your application records a measurement determines which references it can attach. To learn more, read Using exemplars to link traces and sessions.
The iOS observability plugin does not add a session identifier to the metrics it records. Metrics from iOS applications do not produce session exemplars.
Metrics that you send from an OpenTelemetry collector or another OpenTelemetry pipeline carry trace references as long as your instrumentation emits exemplars and every stage of the pipeline preserves them.
Prerequisites
Exemplars are a display option for individual graphs. They are available on graphs that meet all of the following conditions:
- The graph Source is “Observability metrics.”
- The graph is a time series graph that uses the “Line chart” style. Bar charts, tables, categorical graphs, funnel graphs, and heat maps do not display exemplars.
Display exemplars on a graph
Exemplars are off by default. You can choose to display exemplars when you create or edit a graph.
To create a new graph that includes exemplars, read Creating a time series graph.
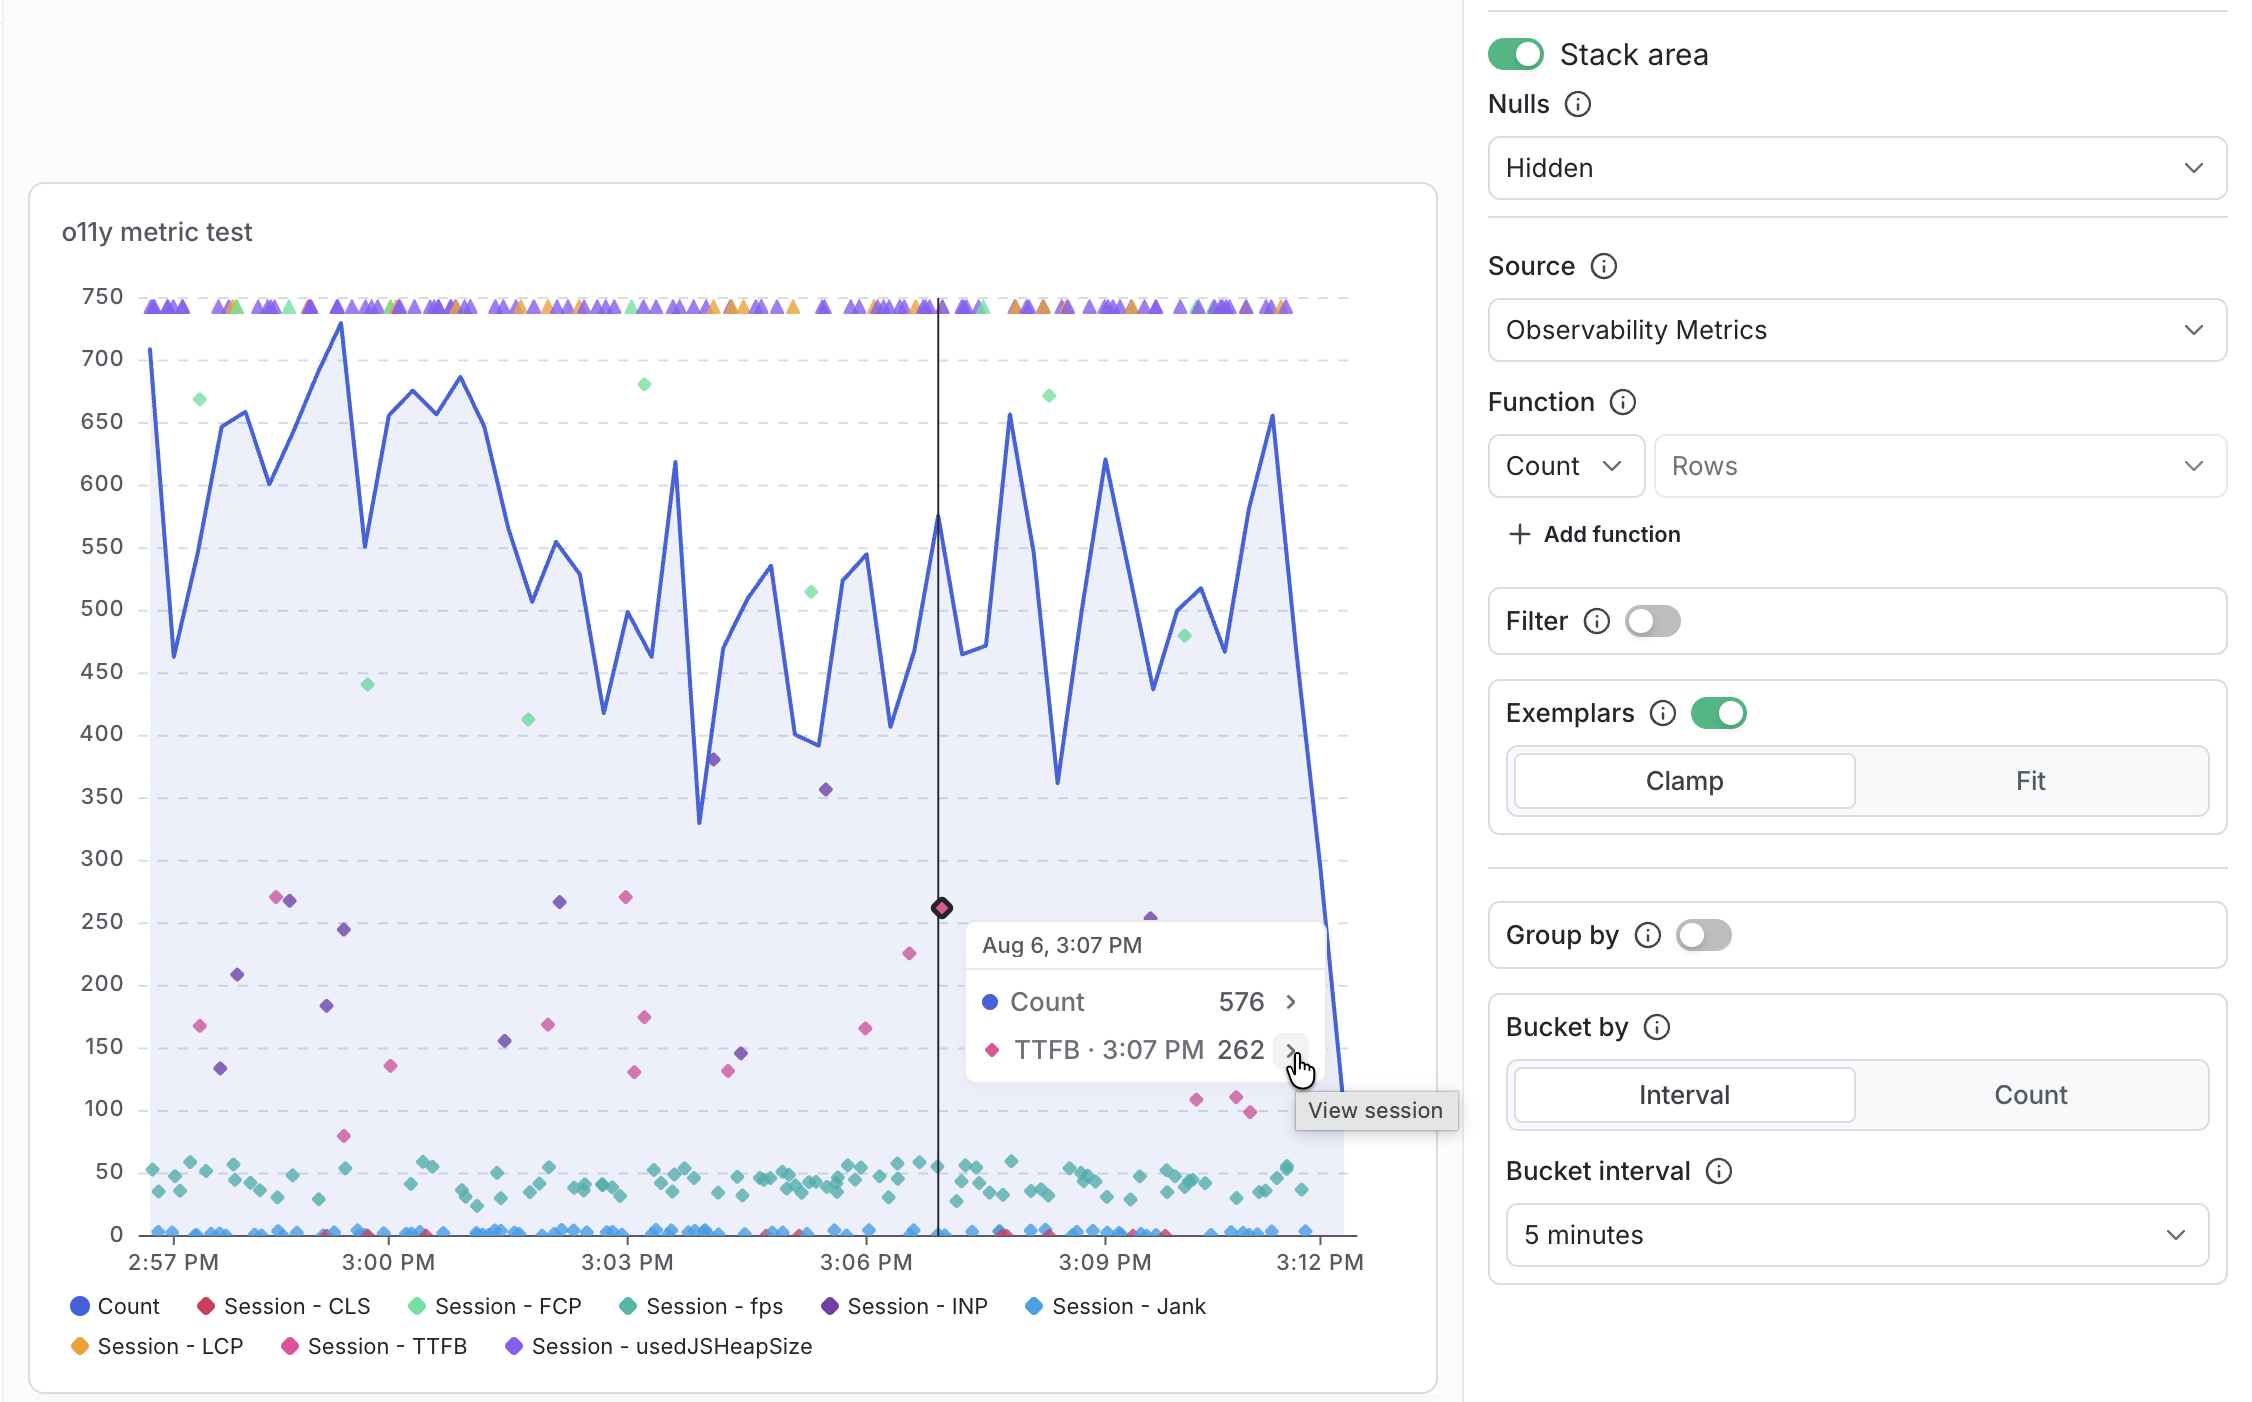
To add exemplars to an existing graph:
- Open the dashboard that contains a compatible graph.
- Click the More actions menu on the graph.
- Click Exemplars.
- Choose how LaunchDarkly scales the y-axis to accommodate exemplars:
- Clamp keeps the y-axis on the range of the metric series. Exemplars with values beyond the y-axis appear as triangles at the top or bottom edge of the graph.
- Fit expands the y-axis so that every exemplar value appears as a diamond within the graph.
Using the exemplar overlay
LaunchDarkly applies distinct colors to the exemplar markers produced by different observability metrics. The graph legend shows the metric names and colors.
Each marker links to the trace or session that recorded the measurement. To open a linked resource:
- Hover over an exemplar marker. The graph tooltip displays a row with the metric name, the time of the measurement, and the measured value in the units of the metric.
- Click the graph to pin the tooltip.
- Click the chevron button on the exemplar row to open the listed trace or session.
The trace span or session opens in a details panel. To learn more about the details view, read Traces or Session replay.
Exemplar sampling and retention
Exemplars are a sample of your measurements rather than a complete record. Keep the following limits in mind when you interpret the overlay:
- LaunchDarkly samples exemplars across the time range of the graph, independent of the measured values. A period without a marker does not mean that period contains no measurements.
- The total number of markers on a graph is capped, so a wider time range produces a sparser overlay for any given period.
- LaunchDarkly retains exemplars for 30 days. If your graph covers a longer range, the overlay includes exemplars only from the last 30 days, even though the metric line extends further back.
Troubleshoot a missing overlay
If you turn exemplars on and the graph displays no markers, check the following:
- The graph uses “Observability metrics” as its source, uses the “Line chart” style, and buckets by timestamp. Exemplars are unavailable on other graph types.
- The time range of the graph falls within the last 30 days. LaunchDarkly does not retain exemplars beyond that.
- Your application records the metric inside an active span, if you expect trace exemplars.
- Your application uses session replay in addition to observability, if you expect session exemplars. Metrics recorded by the iOS plugin do not produce session exemplars.
- Sampling is a factor, so a short time range over a low-volume metric can return no markers.