LLM observability
This topic explains how to instrument your application with the LaunchDarkly observability SDK and analyze large language model (LLM) spans. LLM observability lets you monitor how your large language models behave in production.
When your application calls an LLM provider, LaunchDarkly captures telemetry about the request and records it as an LLM span. Use this data to investigate latency, token usage, errors, and model behavior across environments.
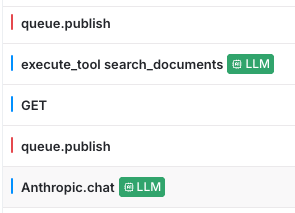
Open the Telemetry section and navigate to the Traces list to explore captured spans. LaunchDarkly marks LLM spans with a green indicator. Select a span to view model-specific telemetry in the LLM Summary and All Attributes tabs.
LLM observability helps your team:
- Monitor latency and token usage
- Investigate provider errors
- Review prompt and response content
- Compare model behavior across environments
How LLM observability works
When your application calls an LLM provider:
- Instrumentation captures telemetry about the model request.
- The LaunchDarkly observability SDK exports that telemetry.
- LaunchDarkly records the request as an LLM span, which appears on the Traces page.
LLM spans include the model name, prompt and response content, token usage, request duration, and provider information. LaunchDarkly marks LLM spans with a green indicator labeled “LLM” in the traces view.
Set up LLM observability
Before you begin, confirm that you have:
- Access to LaunchDarkly observability
- A LaunchDarkly SDK key for your environment
Configuration requirements vary by SDK.
Python
To enable LLM observability in Python:
- Configure the LaunchDarkly observability components.
- Initialize your LLM provider.
Supported providers do not require additional instrumentation libraries.
After setup, LaunchDarkly records model calls as LLM spans on the Traces page.
Node.js
To enable LLM observability in Node.js:
- Install and initialize the Node.js (server-side) SDK.
- Register provider instrumentation for your LLM library.
- Initialize your LLM provider.
Examples of registering your provider instrumentation and initializing your LLM provider are shown below. Initialize the LaunchDarkly SDK before your provider so LaunchDarkly can capture LLM spans correctly.
After setup, LaunchDarkly records model calls as LLM spans on the Traces page.
Example: JavaScript provider instrumentation
To instrument OpenAI in a Node.js application:
- Install the provider instrumentation package:
- Register the instrumentation in your application:
Unsupported providers
If your provider does not support automatic instrumentation, you can manually instrument LLM spans.
Manual instrumentation lets you create spans around model calls, attach metadata such as token counts and request duration, and ensure LaunchDarkly associates model activity with LLM spans.
To learn how, read Manually instrument LLM spans.
View and analyze LLM spans
LaunchDarkly displays LLM observability data in two places:
- The Monitoring tab on a config, when spans relate to that config
- The global Traces page
Each view serves a different purpose.
View traces for a specific config
To view trace data for a config:
- In the left sidebar, click Agents. The AgentControl menu appears.
- Click Configs.
- Open the Monitoring tab.
If LaunchDarkly links spans to that config, it displays them in this panel.
Why “No traces detected” appears
If the config page shows No traces detected, LaunchDarkly has not linked any spans to that config.
LaunchDarkly evaluates configs using a context. To associate spans with a config:
- The config must evaluate with a valid context.
- The LLM call must occur within the same request flow.
If your application calls a model without a LaunchDarkly context, or outside the config evaluation flow, LaunchDarkly records the span on the global Traces page but does not associate it with the config.
View all LLM spans
To explore all captured LLM spans, open the Telemetry section and navigate to the Traces list.
The Traces page lists all captured spans, including LLM spans that may not relate to a specific config.
LaunchDarkly marks LLM spans with a green indicator. Select a span to view detailed model telemetry.
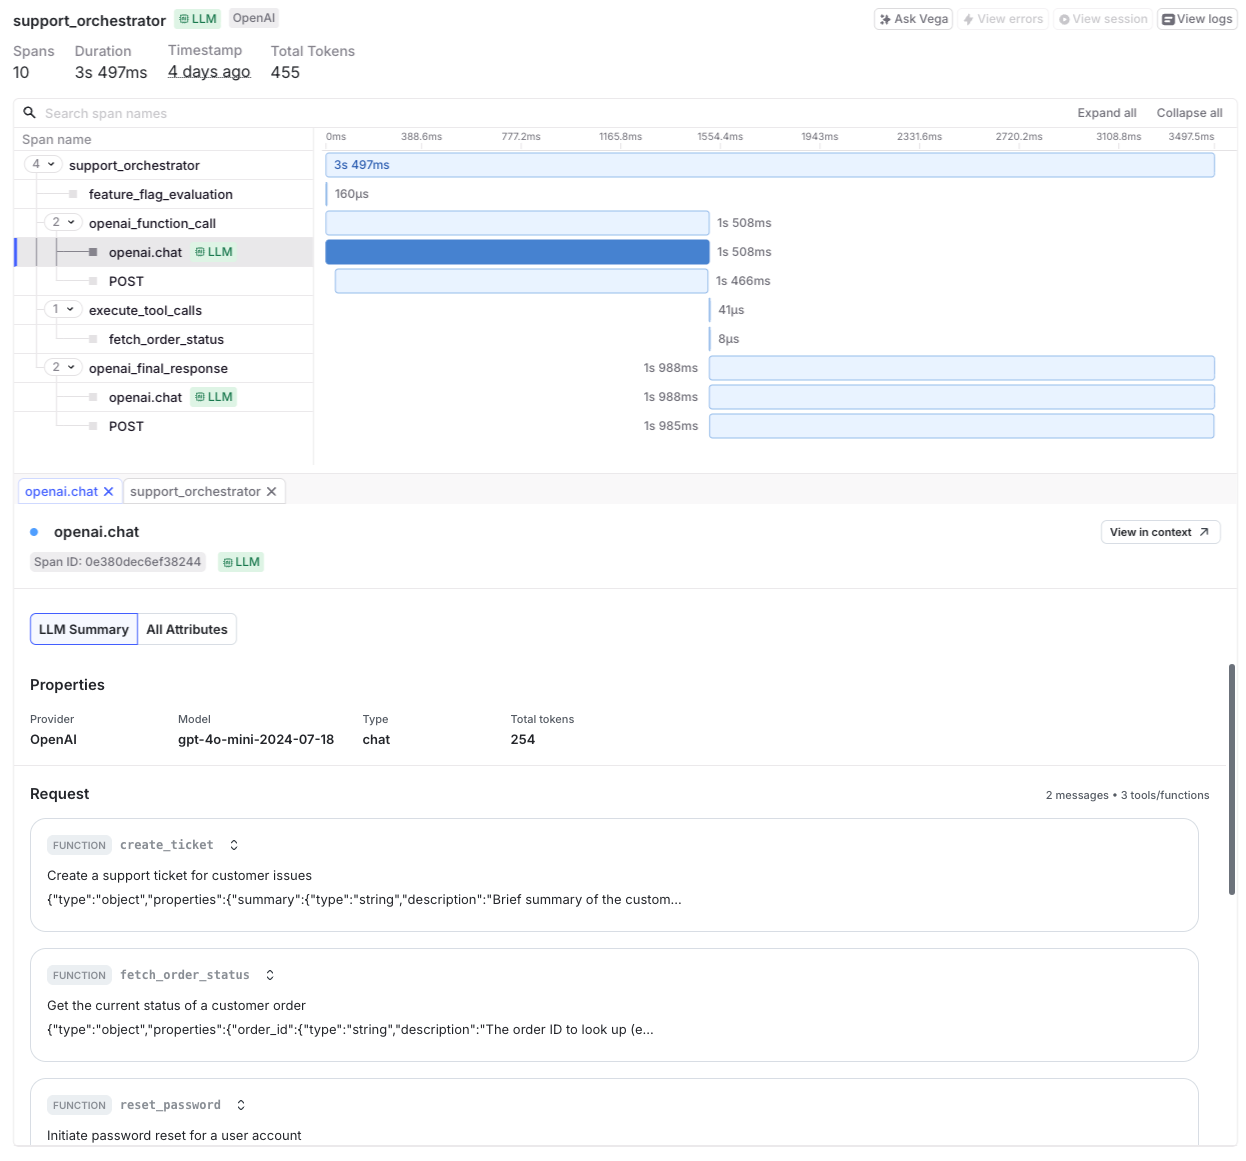
Use the search bar, filters, and time range selector to analyze spans.
The trace detail panel shows a timeline of generation steps and related spans, provider and model metadata such as latency and token usage, prompt and response content, and any provider errors or exceptions.
Standard LLM span attributes
LLM spans include standardized attributes such as:
gen_ai.modelgen_ai.providergen_ai.prompt_tokensgen_ai.completion_tokensgen_ai.total_tokensgen_ai.inputgen_ai.outputdurationservice.name
Use these attributes to filter, search, and investigate model behavior.
Associate traces with AgentControl
LLM observability captures spans for any instrumented model call. When you use LaunchDarkly AgentControl together with the LaunchDarkly Observability plugin and spans are successfully exported, LaunchDarkly associates traces with the AgentControl config that generated them.
The AI SDK annotates the root span with the underlying feature flag key for the evaluated config. LaunchDarkly uses this annotation to link related spans to the correct config when spans are exported through the Observability SDK.
With this integration, you can:
- Filter traces by config key or variation
- Correlate model behavior with variations and targeting
- Investigate latency, errors, and quality signals in context
If you do not use the LaunchDarkly Observability SDK, you can still associate traces with AgentControl by adding span attributes in your tracing pipeline. For example, attach the AgentControl config key and evaluated variation to the root span when your application calls the model provider.
Use cases for LLM observability
Use LLM observability to:
- Optimize latency and cost by monitoring token usage and request duration
- Identify runtime errors by correlating failed generations with provider exceptions
- Validate model outputs by reviewing prompt and response pairs
- Analyze downstream impact by connecting LLM spans with session or error data
Privacy and data handling
LLM spans may include prompt and response text. This data can contain PII depending on your application.
Review your organization’s data-handling policies before enabling LLM observability. Redact sensitive data at the source if required.