
Services
This topic explains how to use the services views in LaunchDarkly observability.
LaunchDarkly uses your distributed traces to discover the services in your project. The service_name attribute in your spans determines each service’s name, and parent-child span relationships indicate which services call each other. Every service that appears in your traces during the selected time range also appears in the services views.
The services views present the same set of services in two different ways:
- Map: An interactive dependency graph. Use this view to understand how your services connect to each other.
- List: A table with request and error volume for each service. Use the list view to quickly compare different services or to find a service by name.
Both views respect the dashboard’s time range selector. If you adjust the time range, the views update to reflect service activity within the new window.
You can use either view to open a service’s details panel to review its health metrics, operations, flags, alerts, errors, and dependencies. To learn more, read Service details.
Each details panel also has a Settings tab, where you can narrow which spans count toward an individual service’s metrics. To learn more, read Root span filter.
Prerequisites
To use the services views, you need:
- Tracing instrumentation configured for your services. To learn more, read Traces.
- Trace data received within the time range you select.
Access the Services views
To access the services views:
- Navigate to Observability > Dashboards.
- Select Services from the list of available dashboards.
- Click List or Map.
If the services views appear empty, confirm that you configured tracing instrumentation for your services and that the selected time range includes this trace data. Try expanding the time range if you expect data to be present.
Use the map view
The map view displays your services as nodes and their call relationships as directional edges. When two services call each other, the edge between them is bidirectional.
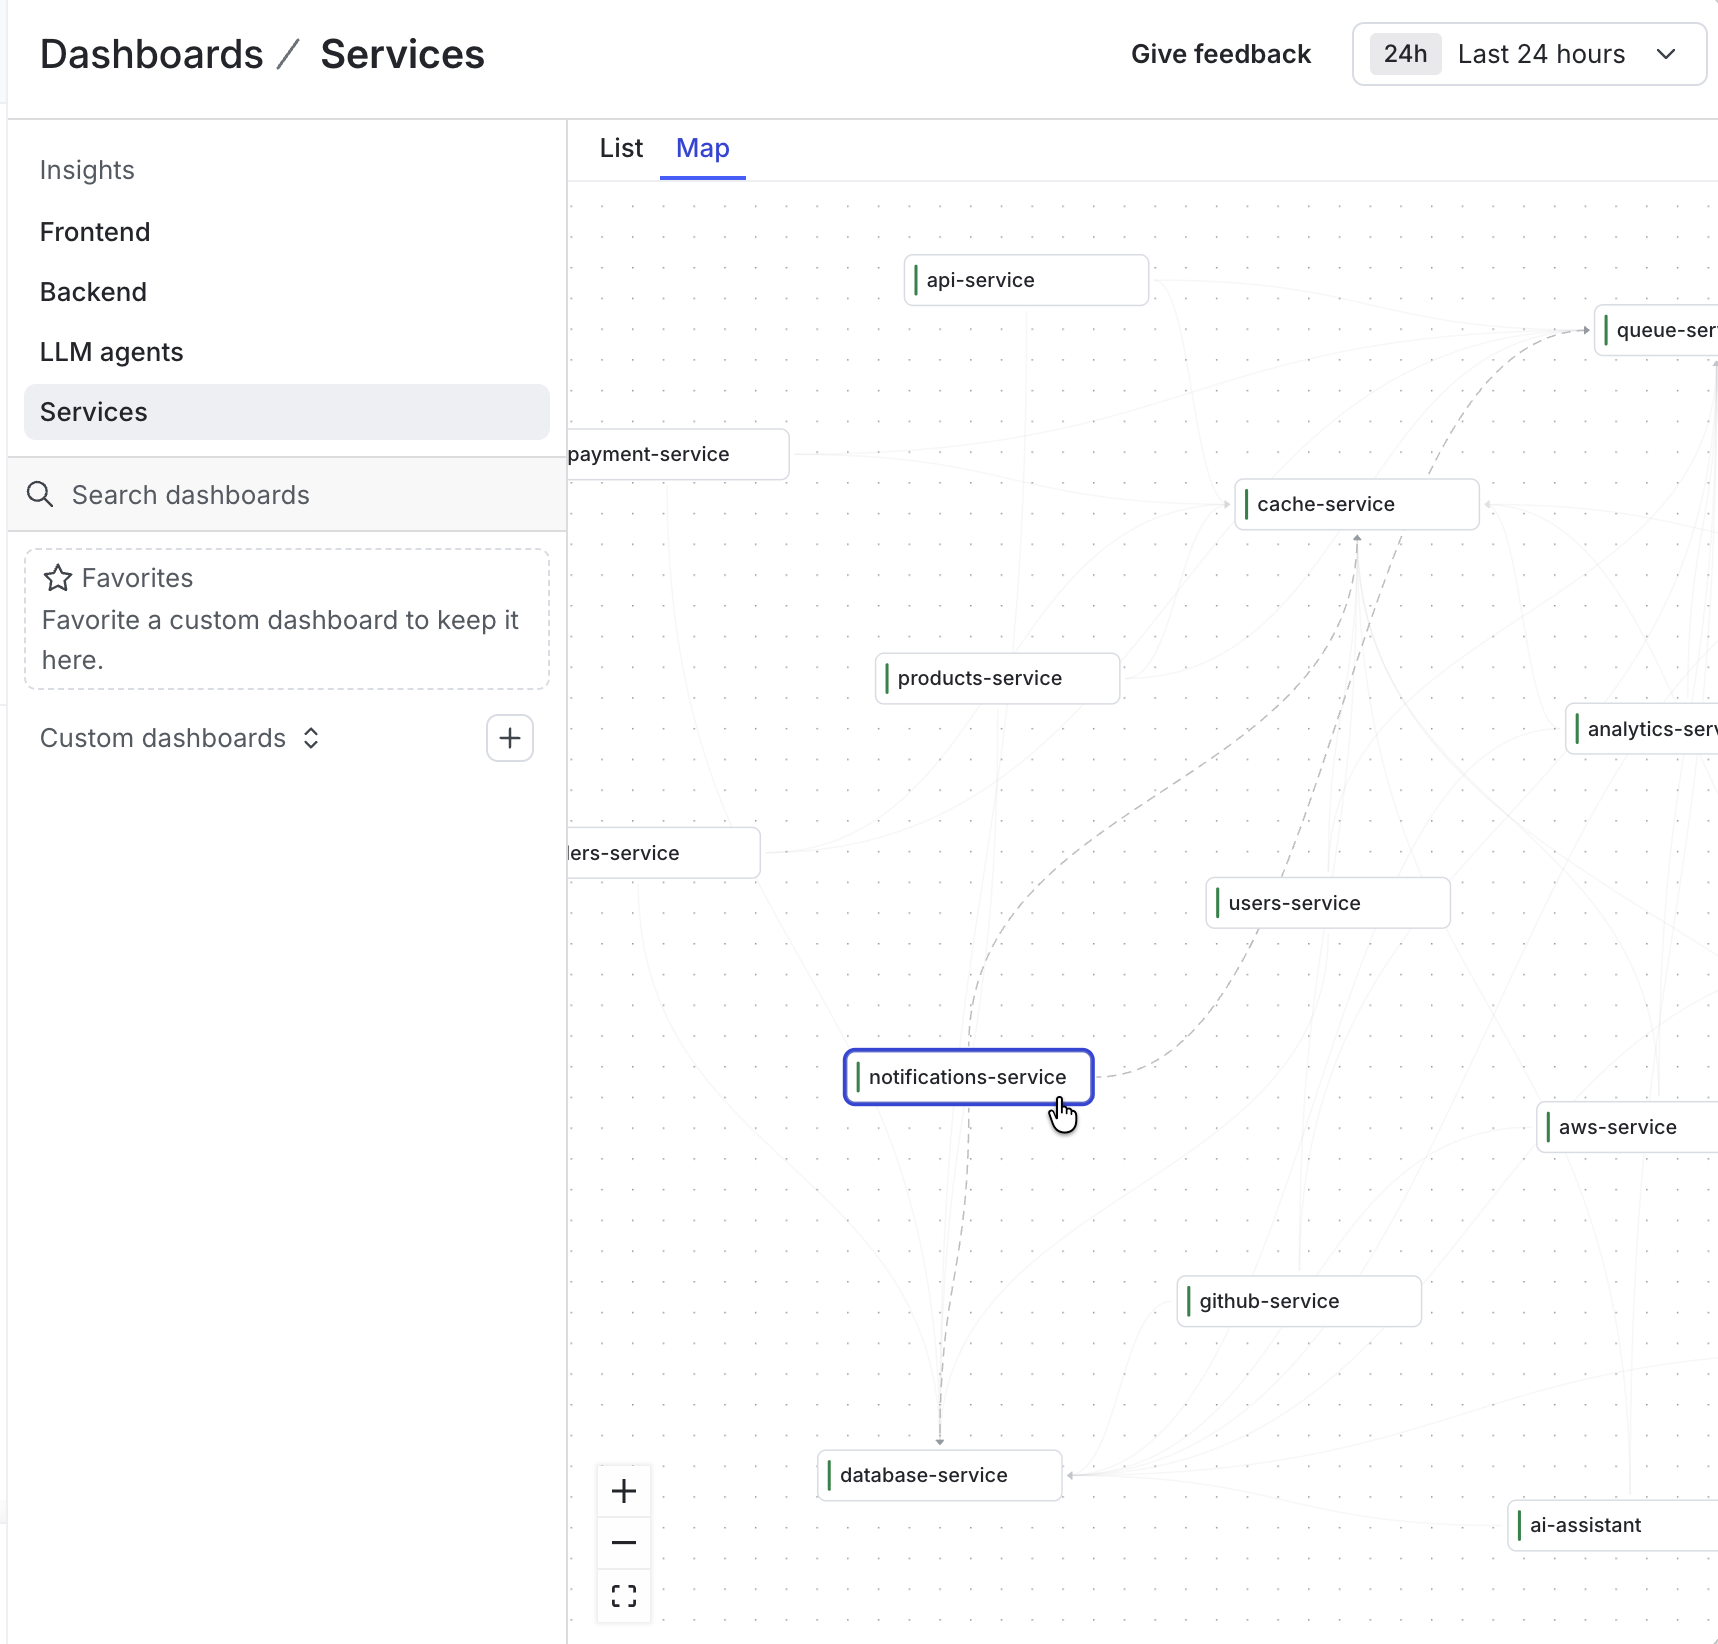
You can pan the map by dragging it, and zoom using the map’s controls. Hover over a service to highlight the connections between that service and its neighbors.
To open a service’s details panel, click its node. The panel’s Dependencies tab displays the same map, narrowed to the service’s immediate neighbors. To learn more, read Dependencies.
Use the list view
The list view displays one row per service, with a small graph and a total for the selected time range. LaunchDarkly lists services in alphabetical order by name.
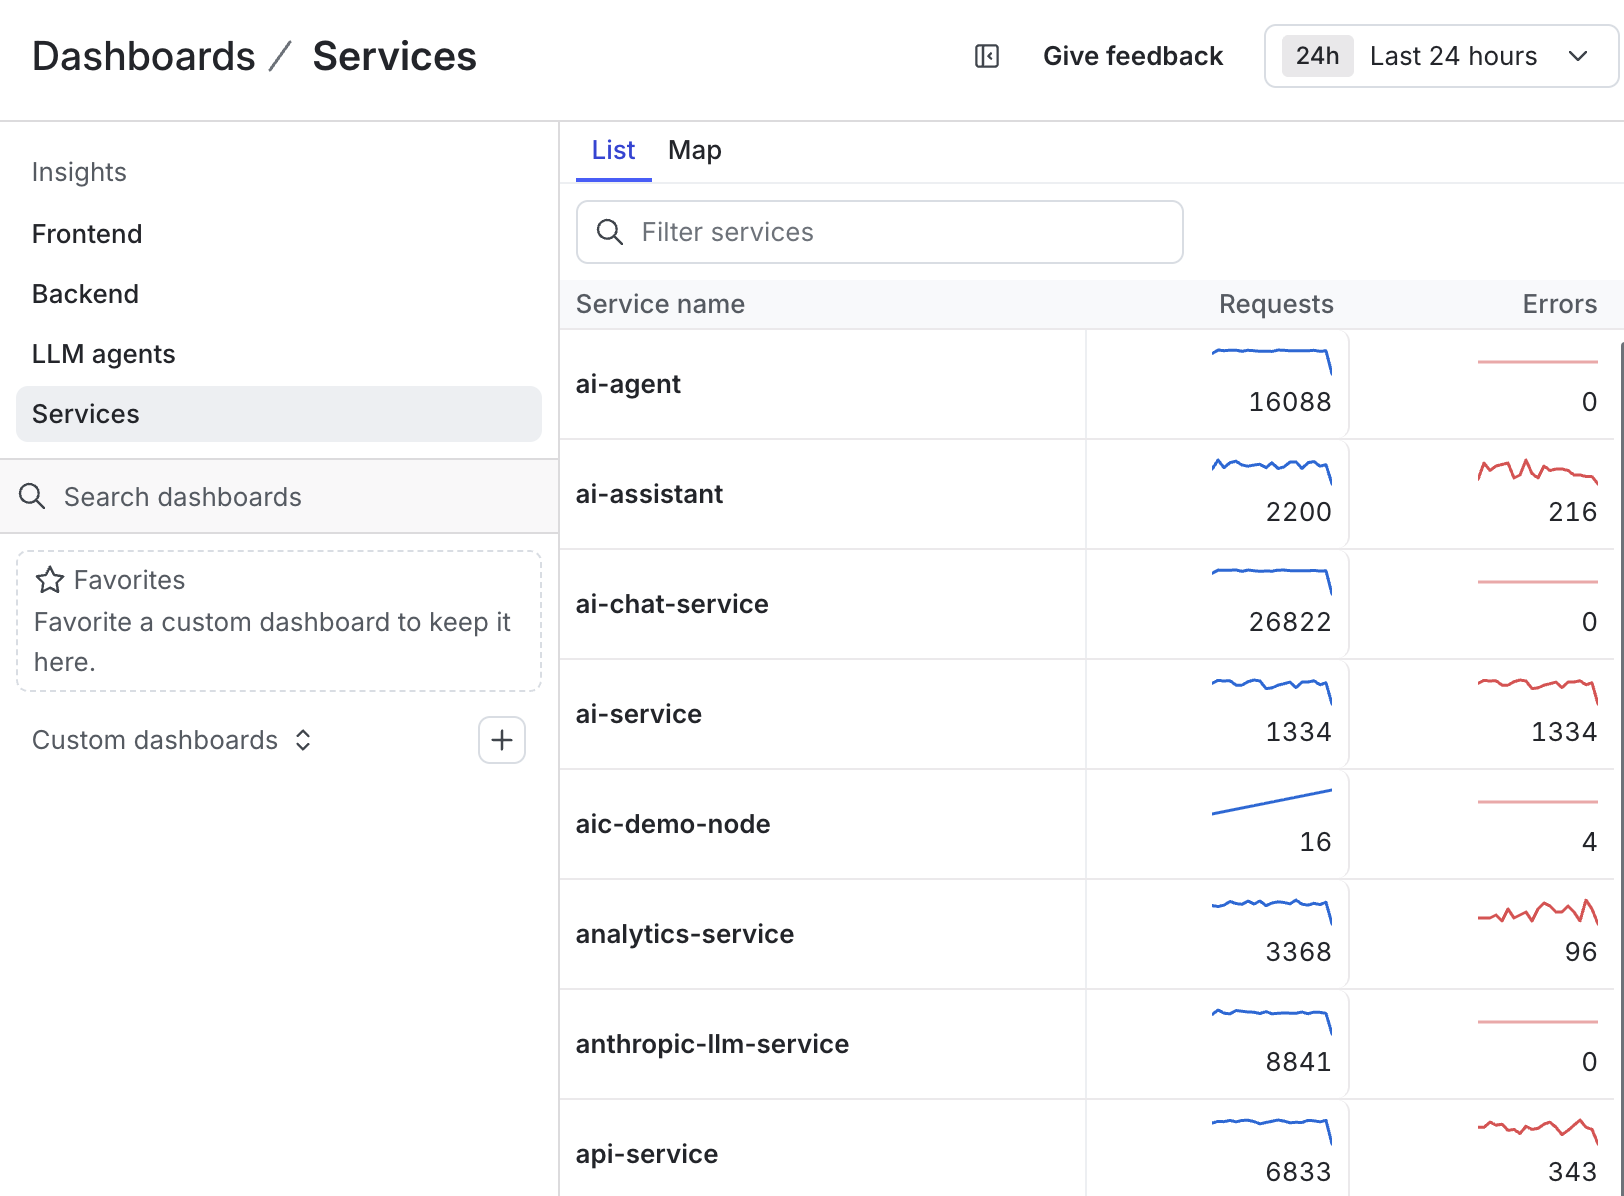
The list view includes the following columns:
To narrow the list to specific services, enter a name in the “Filter services” field.
To open a service’s details panel, click its row. The panel charts these same counts over time, and breaks them down by operation. To learn more, read Health metrics and Operations.