
Service details
This topic explains how to use a service’s details panel in LaunchDarkly observability.
A service’s details panel collects everything LaunchDarkly knows about a single service into one view. The view includes information such as:
- The service’s request, error, and duration metrics
- The slowest and busiest operations
- Any flags that the service evaluated
- Observability alerts that reference the service
- Recent errors
- The service’s immediate dependencies
Use the details panel to assess the health of one service, or use it as a starting point when you are investigating an incident that involves a particular service.
Each details panel has the following tabs:
- Monitoring: Displays the service’s telemetry. To learn more, read Monitoring tab.
- Settings: Provides configuration options to change how LaunchDarkly interprets this service’s telemetry. To learn more, read Settings tab.
Prerequisites
To use a service’s details panel, you need:
- Tracing instrumentation configured for the service. To learn more, read Traces.
- Trace data received within the time range you select.
Access a service’s details panel
To access a service’s details panel:
- Navigate to Observability > Dashboards.
- Select Services from the list of dashboards.
- Click List or Map.
- Click the service you want to review. Click the service’s row in list view, or click the service’s node in map view.
The service details panel opens, with the Monitoring tab selected.
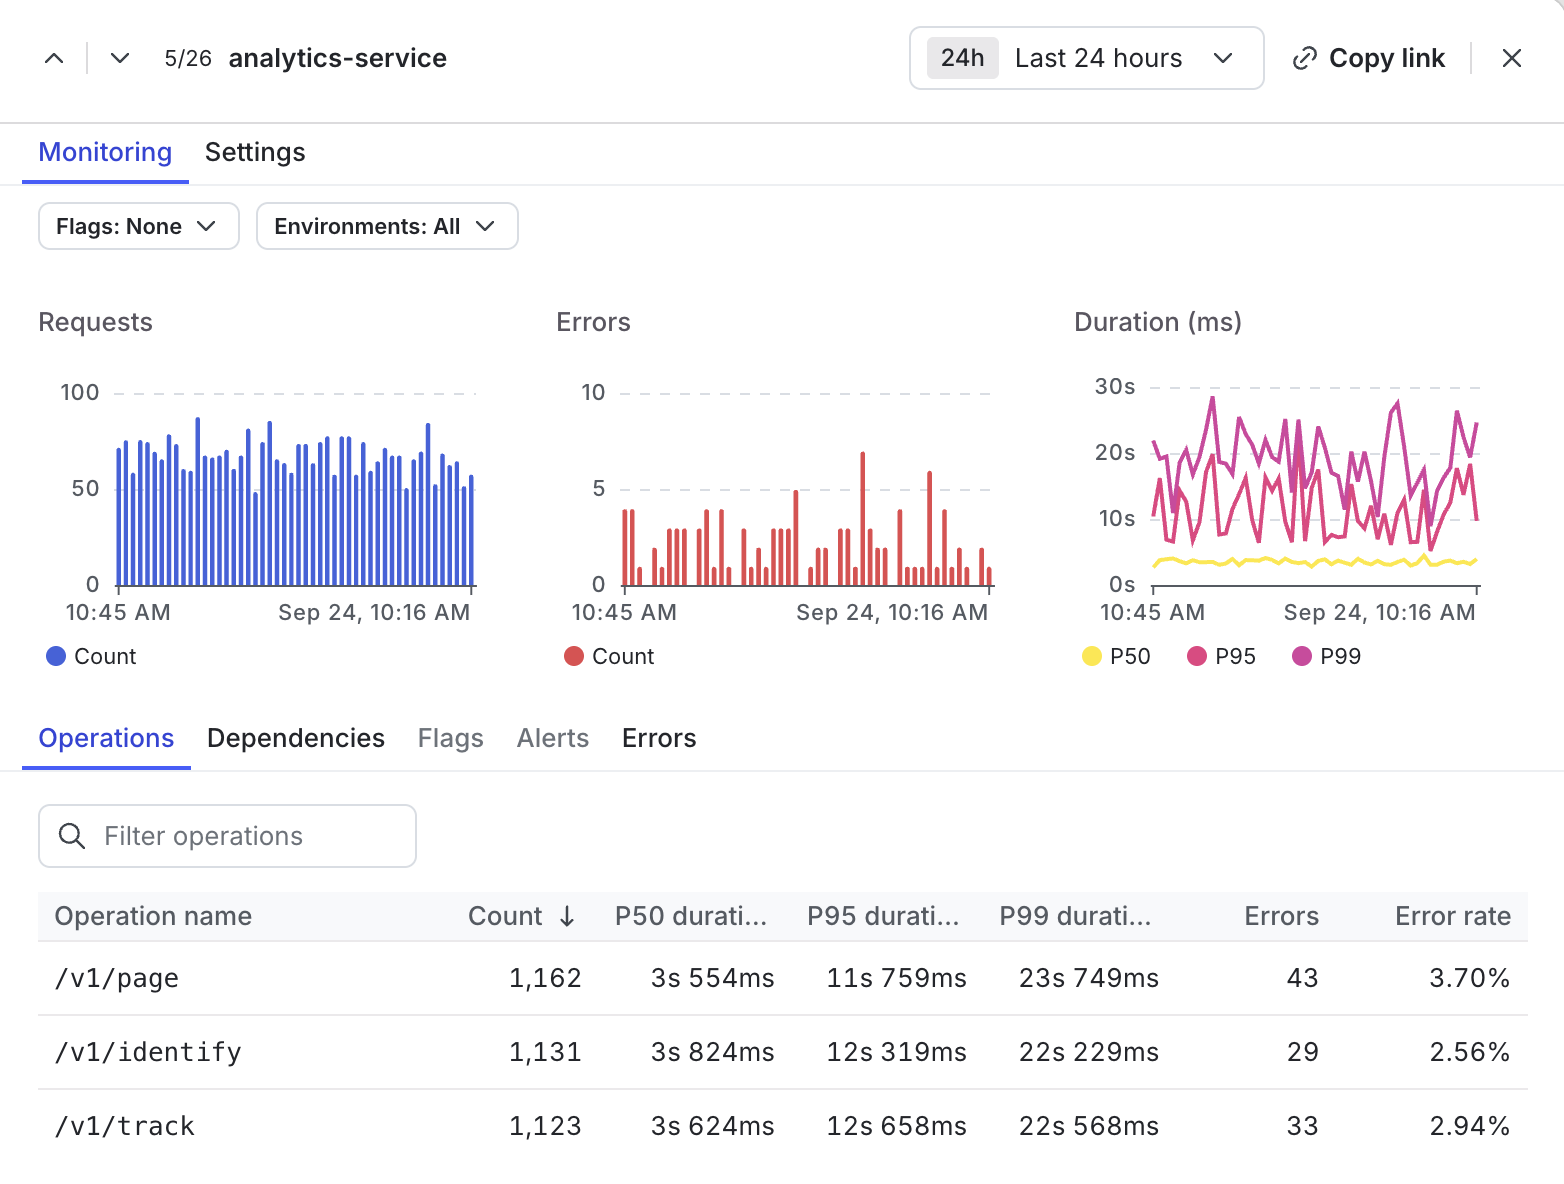
If you open the panel from list view or map view, you can move between services without closing it. The panel header displays the service’s position among the services in that view, such as “5/26.” Click the previous and next buttons beside it to open the neighboring service in alphabetical order. In list view, the buttons move only through the services that match the “Filter services” field.
You can also open a service’s details panel from these places:
- The Dependencies tab in another service’s panel. To learn more, read Dependencies.
- The “Service Name” column of the Spans tab on the Traces page. Click the service name.
- The “Root service” column of the Traces tab on the Traces page. Click the service name.
To learn more about the Traces page, read Traces.
Monitoring tab
The Monitoring tab displays the service’s telemetry for a time range you select. Use the date range picker to change the time range.
The tab has two parts:
- The health metrics charts. To learn more, read Health metrics.
- A set of tabs that break the service’s telemetry down by category: Operations, Dependencies, Flags, Alerts, and Errors.
All information on the Monitoring tab reflects the time range you select, except for Alerts. The Alerts tab always displays the alerts that are currently configured in your project.
The Operations and Dependencies tabs are always available. LaunchDarkly disables the Flags, Alerts, and Errors tabs if it found no data of that kind for the service. A disabled tab means the service has nothing to display in that category, not that the category is unavailable to you.
Every tab except Dependencies has a filter field that narrows the rows the tab already loaded. The filter matches the tab’s primary column, such as the operation name on the Operations tab or the flag key on the Flags tab. If nothing matches what you enter, the tab displays “No matches for” followed by your text.
Several parts of the Monitoring tab replace the panel’s contents with a related resource, such as the traces behind an operation. When this happens, a back arrow appears in the panel header. Click the back arrow to return to the service.
Health metrics
Three charts summarize the service’s health over time:
To zoom into a narrower time range, click and drag across any of the charts.
Each chart can also open the traces behind a point in time. To review these traces:
- Hover over the chart’s graphed data. A tooltip displays the data points for that time.
- Click to freeze the tooltip. The tooltip displays a details link for each data point.
- Click a details link. The traces open in the same panel, filtered to the chart’s query and to the time bucket you selected.
To learn more about how graph details work on dashboards, read View graph details.
Flag targeting changes
You can overlay flag targeting changes on the health metrics charts to correlate flag and service behavior changes with each other.
To overlay targeting changes, select one or more flags from the Flags dropdown. Markers appear on the time axis of each chart at the timestamp of each targeting change. Hover over a marker to display details about the change.
The dropdown lists only the flags that LaunchDarkly observed this service evaluate during the selected time range. Select All flags to scope the markers to the selected service rather than to your whole project.
To limit the overlay to specific environments, select one or more environments from the Environments dropdown. The dropdown displays “Environments: All” by default, which includes targeting changes from every environment in your project. Use the “Search environments” field to find an environment by name or key, or select All environments to clear your selection.
Your environment selection also filters the Requests, Errors, and Duration (ms) charts, the Operations tab, and the Dependencies tab. It does not affect the Flags, Alerts, or Errors tabs.
LaunchDarkly filters by environment using the feature_flag.set.id attribute, which is only available in spans that contain a feature flag span event. When you select an environment, the Requests, Errors, and Duration (ms) charts and the Operations tab include only those spans that recorded a flag evaluation for that environment. This is a subset of the service’s spans. The charts and the tab display lower counts than the service’s totals. Select All environments to restore the service’s full telemetry.
To learn how the same overlay works on dashboards, read Viewing flag targeting changes.
Operations
The Operations tab breaks the service down by operation. You can use this tab to find which operations are slowest, busiest, or most error-prone.
The tab includes the following columns:
Click any column header to sort by that column. Click the header again to reverse the sort order. Click a row to open the traces behind an operation in the same panel.
The tab loads the 100 operations with the most spans and displays 25 of them per page. If the service has more than one page of operations, click Previous and Next to move between pages.
Dependencies
The Dependencies tab displays the portion of the service map immediately surrounding this service. This includes the services it calls, and the services that call it. The graph reflects the environments you select from the Environments dropdown. If you have not selected an environment, the graph includes every environment in your project.
Drag the graph to pan the view. To zoom, use the graph’s controls, or hold Command on Mac or Control on Windows and Linux while you scroll. Hover over a node to highlight its connections. Click a node to display a neighboring service in the same panel.
If LaunchDarkly recorded no connections for the service, the tab displays “No service dependency data available.”
To review the dependency graph for every service in your project, read Services.
Flags
The Flags tab lists the flags that LaunchDarkly observed this service evaluate during the selected time range. The table lists each flag’s key and the number of evaluations that were recorded.
LaunchDarkly derives this list from the feature_flag.key attribute on the service’s spans, then resolves each observed key to a flag in your project. Keys that no longer resolve to a flag, such as a flag that has been deleted since the evaluation was recorded, do not appear.
To open a flag’s monitoring view, click its key. A flag’s monitoring view is specific to an environment. If your current view does not have an environment selected, the tab displays each key as text rather than as a link.
Alerts
The Alerts tab displays the alerts in your project whose query references this service. LaunchDarkly determines this by parsing each alert’s query for a service_name filter that matches the service.
The tab includes the alert’s name, type, status, and query. To open an alert, click its name.
To learn more about creating and managing alerts, read Alerts.
Errors
The Errors tab displays up to 50 of the error groups recorded for the service during the selected time range.
The tab includes the following columns:
By default, the tab lists the most recently active error groups first. Last occurrence is the only sortable column. Click its header to sort by it, and click the header again to reverse the sort order.
To open an error group’s details in the same panel, click its row.
To learn more about errors, read Error monitoring.
Settings tab
The Settings tab configures how LaunchDarkly interprets this service’s telemetry. Settings apply to the individual service and are separate from the observability settings that apply to your whole project.
Root span filter
Some services record spans that you do not want to be included in the service’s health metrics, such as health check endpoints or background polling. Use Root Span Filter to narrow the spans that the Requests, Errors, and Duration (ms) charts and the Operations tab include.
LaunchDarkly combines the root span filter with the service’s own name filter. A span must match both to be included. The filter does not affect the Flags, Alerts, Errors, or Dependencies tabs.
To set a service’s root span filter:
- Open the service’s details panel.
- Click the Settings tab.
- Enter a query in the Root Span Filter field. The field suggests trace attributes as you type.
- Click Save.
The root span filter accepts the same syntax as the rest of the LaunchDarkly observability pages. To learn more, read Search specification.
Here is an example filter that excludes health check spans:
Viewing a service’s settings requires the viewProject action. Saving a service’s settings requires the updateObservabilityGeneralSettings action, the same action that project-level observability settings require. To learn more, read Using actions.