

Why Observability Matters for Databases
It may not be obvious why observability matters for databases, so let’s quickly cover the benefits. We can collect a few types of data about our database:- Infrastructure metrics (e.g. CPU, memory, disk, etc.)
- Query performance (latency, errors, etc.)
- Resource utilization (connections, threads, etc.)
- Slow queries
- High error rates
- Connection pool bottlenecks
- Resource contention
How to Integrate OpenTelemetry with GORM
The GORM OpenTelemetry plugin is a great way to integrate OpenTelemetry with GORM. It’s easy to install and use, and it provides a lot of useful data about your database. First, install the plugin:How to Use Traces and Metrics to Diagnose and Optimize
Now that we have traces and metrics, how do we use them to diagnose and optimize our database? For our use case, we’ll use LaunchDarkly to visualize and work with the data.Working with Traces
The GORM plugin will emit spans for each database interaction. If the query is part of an existing trace, the span will be connected to that trace. Here is an example of a web request that triggered a database query: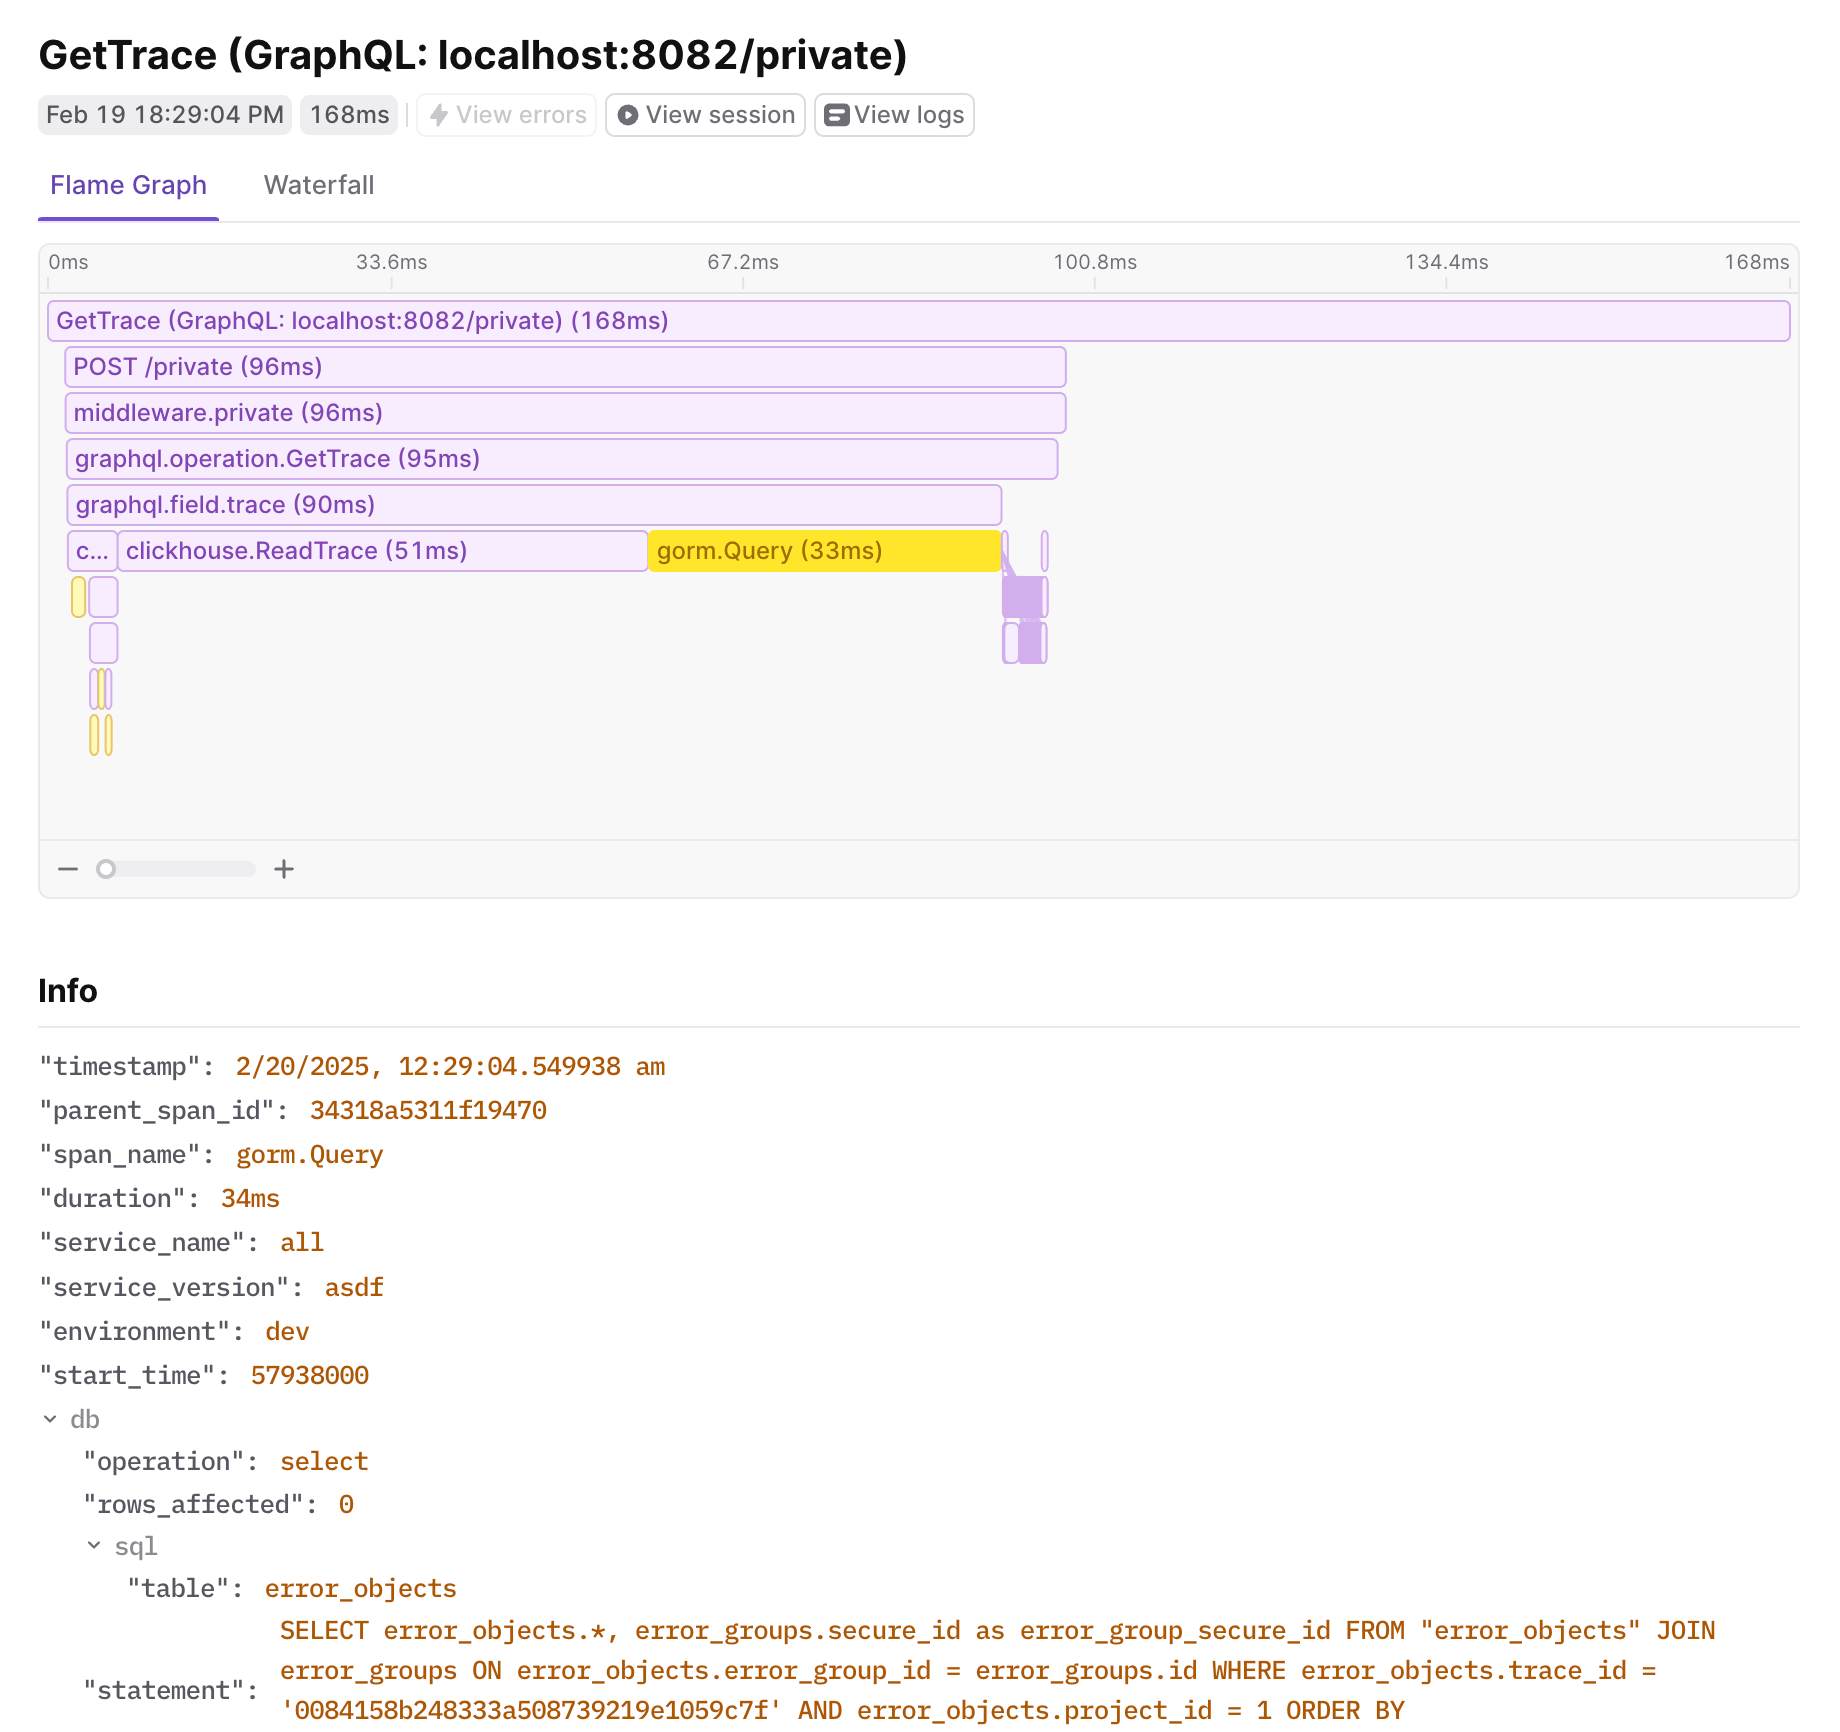
A trace span in LaunchDarkly showing a GORM database query with attributes like duration, SQL statement, and table name.
db key. We get information about the query that can be used to help understand and optimize it. We even get the SQL statement to so we have the exact query to run in a debugging session.
Aggregated Traces
Viewing an individual trace is helpful, but it’s often useful to see aggregate data for database interactions. Since we have attributes likeduration, db.sql.table, and db.operation, we can use these to group and aggregate data.
Here you can see how dashboards are being used to monitor query counts, duration, and details of individual slow queries.
A LaunchDarkly dashboard displaying aggregated GORM metrics including query counts, duration, and details of individual slow queries.