The human-in-the-loop alternative to autonomous remediation
The human-in-the-loop alternative to autonomous remediation
Published May 29, 2026

From triggered alert to root cause in five prompts with Claude Code and the LaunchDarkly observability MCP server
In the previous tutorial, Catch Silent AI Failures using Vega, we saw how alerts can trigger autonomous remediation using telemetry data to pinpoint the root cause. In a single intentional swoop, Vega detects, diagnoses, and rolls back changes to protect the user experience. This works great for most use cases, but if you want the option to investigate incidents yourself with the advantages of an AI assistant, then this tutorial is for you.
Here, you’ll triage a real alert in Claude Code, correlate error groups, traces, and flag evaluations to confirm the root cause, then post the findings to your on-call Slack channel.
Setup
To get started, you’ll need:
- The LaunchDarkly MCP installed in Claude Code.
- An alert to trigger from an error threshold.
Serenia — sales team assistant
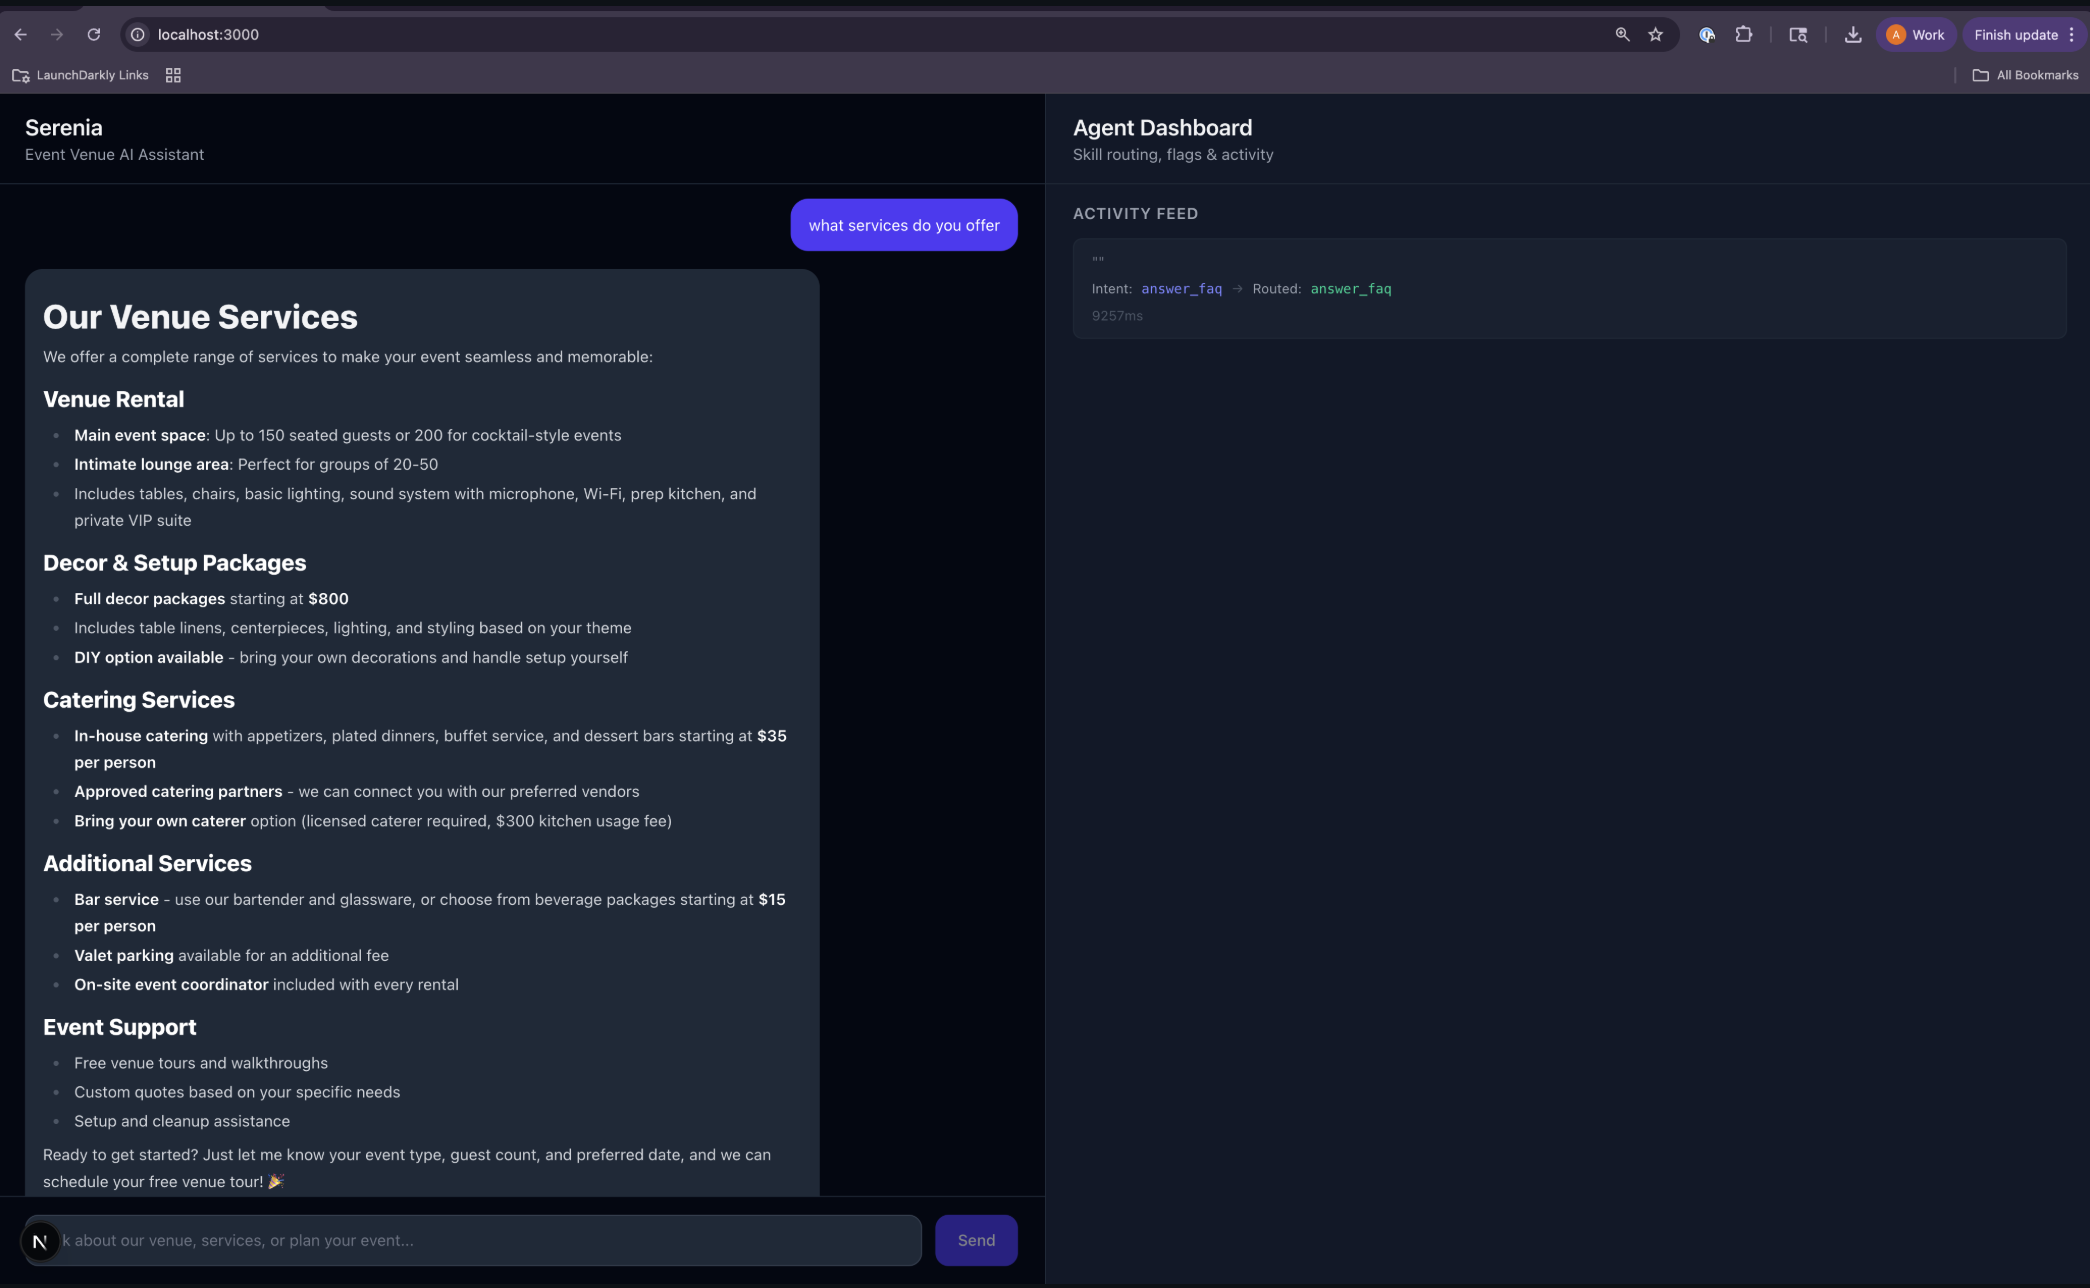
To follow along with this tutorial, clone the Serenia repo, an AI assistant for an event venue business. It has three skills:
answer_faqlog_inquiryqualify_lead
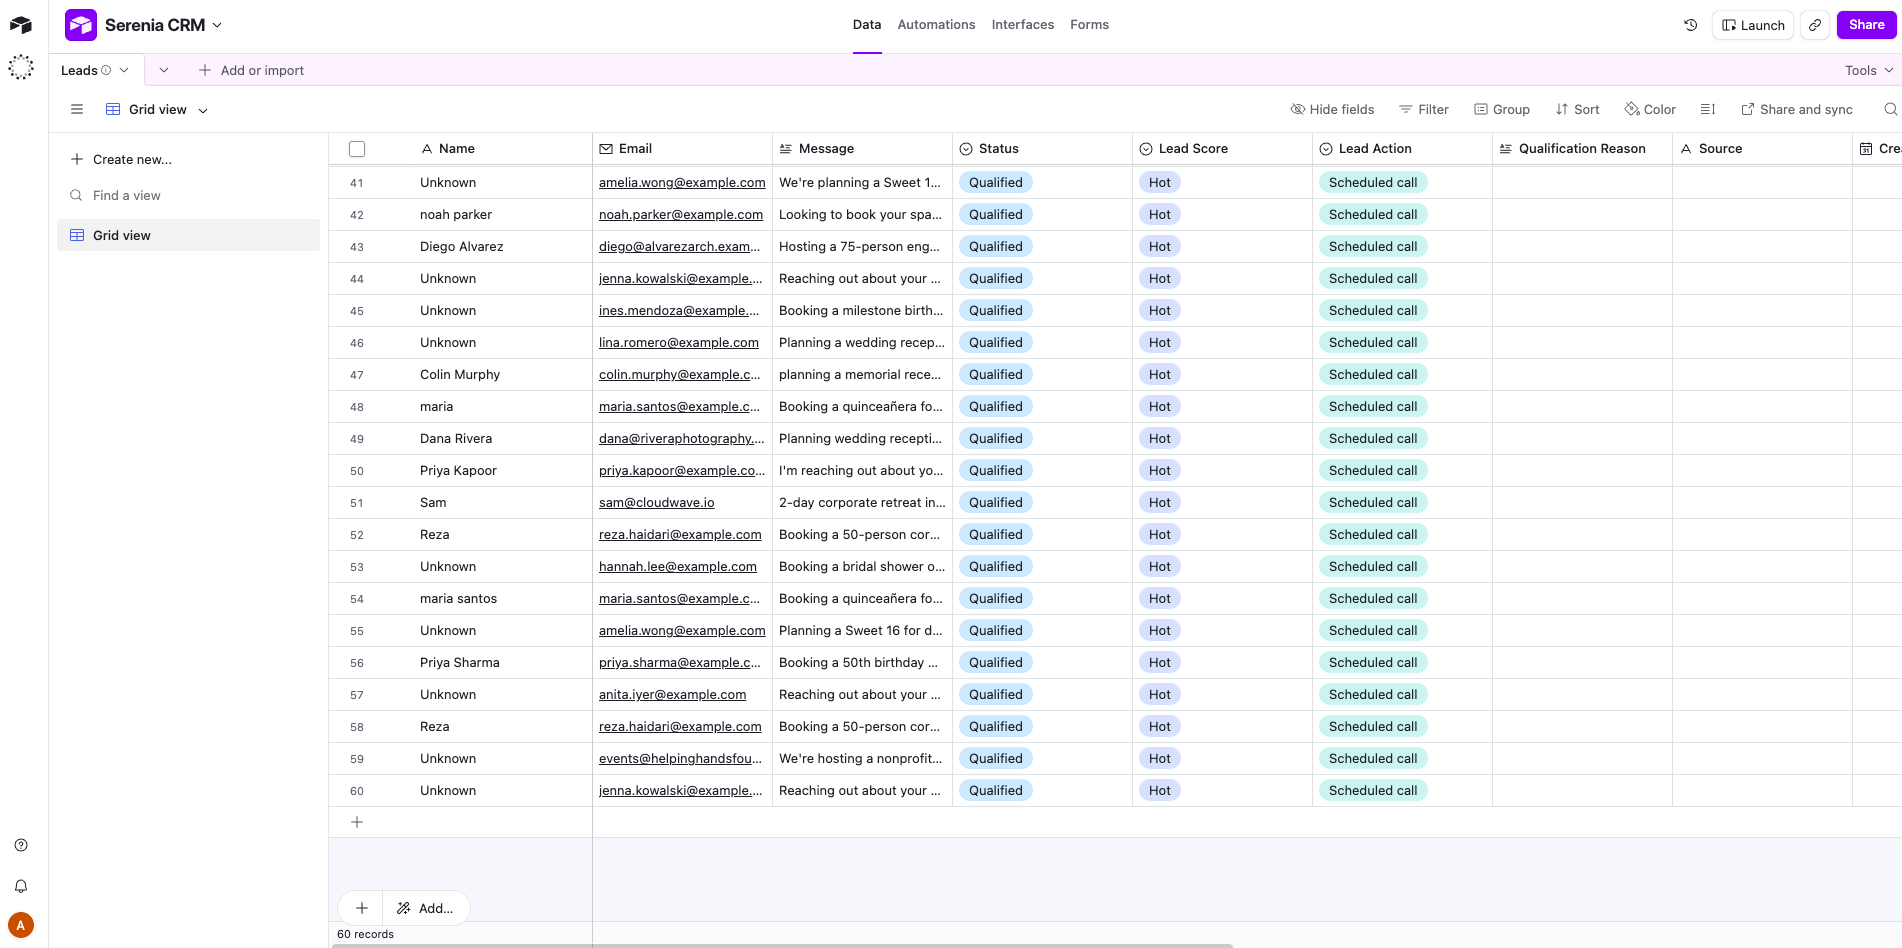
Every inquiry is classified and sent to an Airtable as the CRM backend.
Serenia CRM Airtable
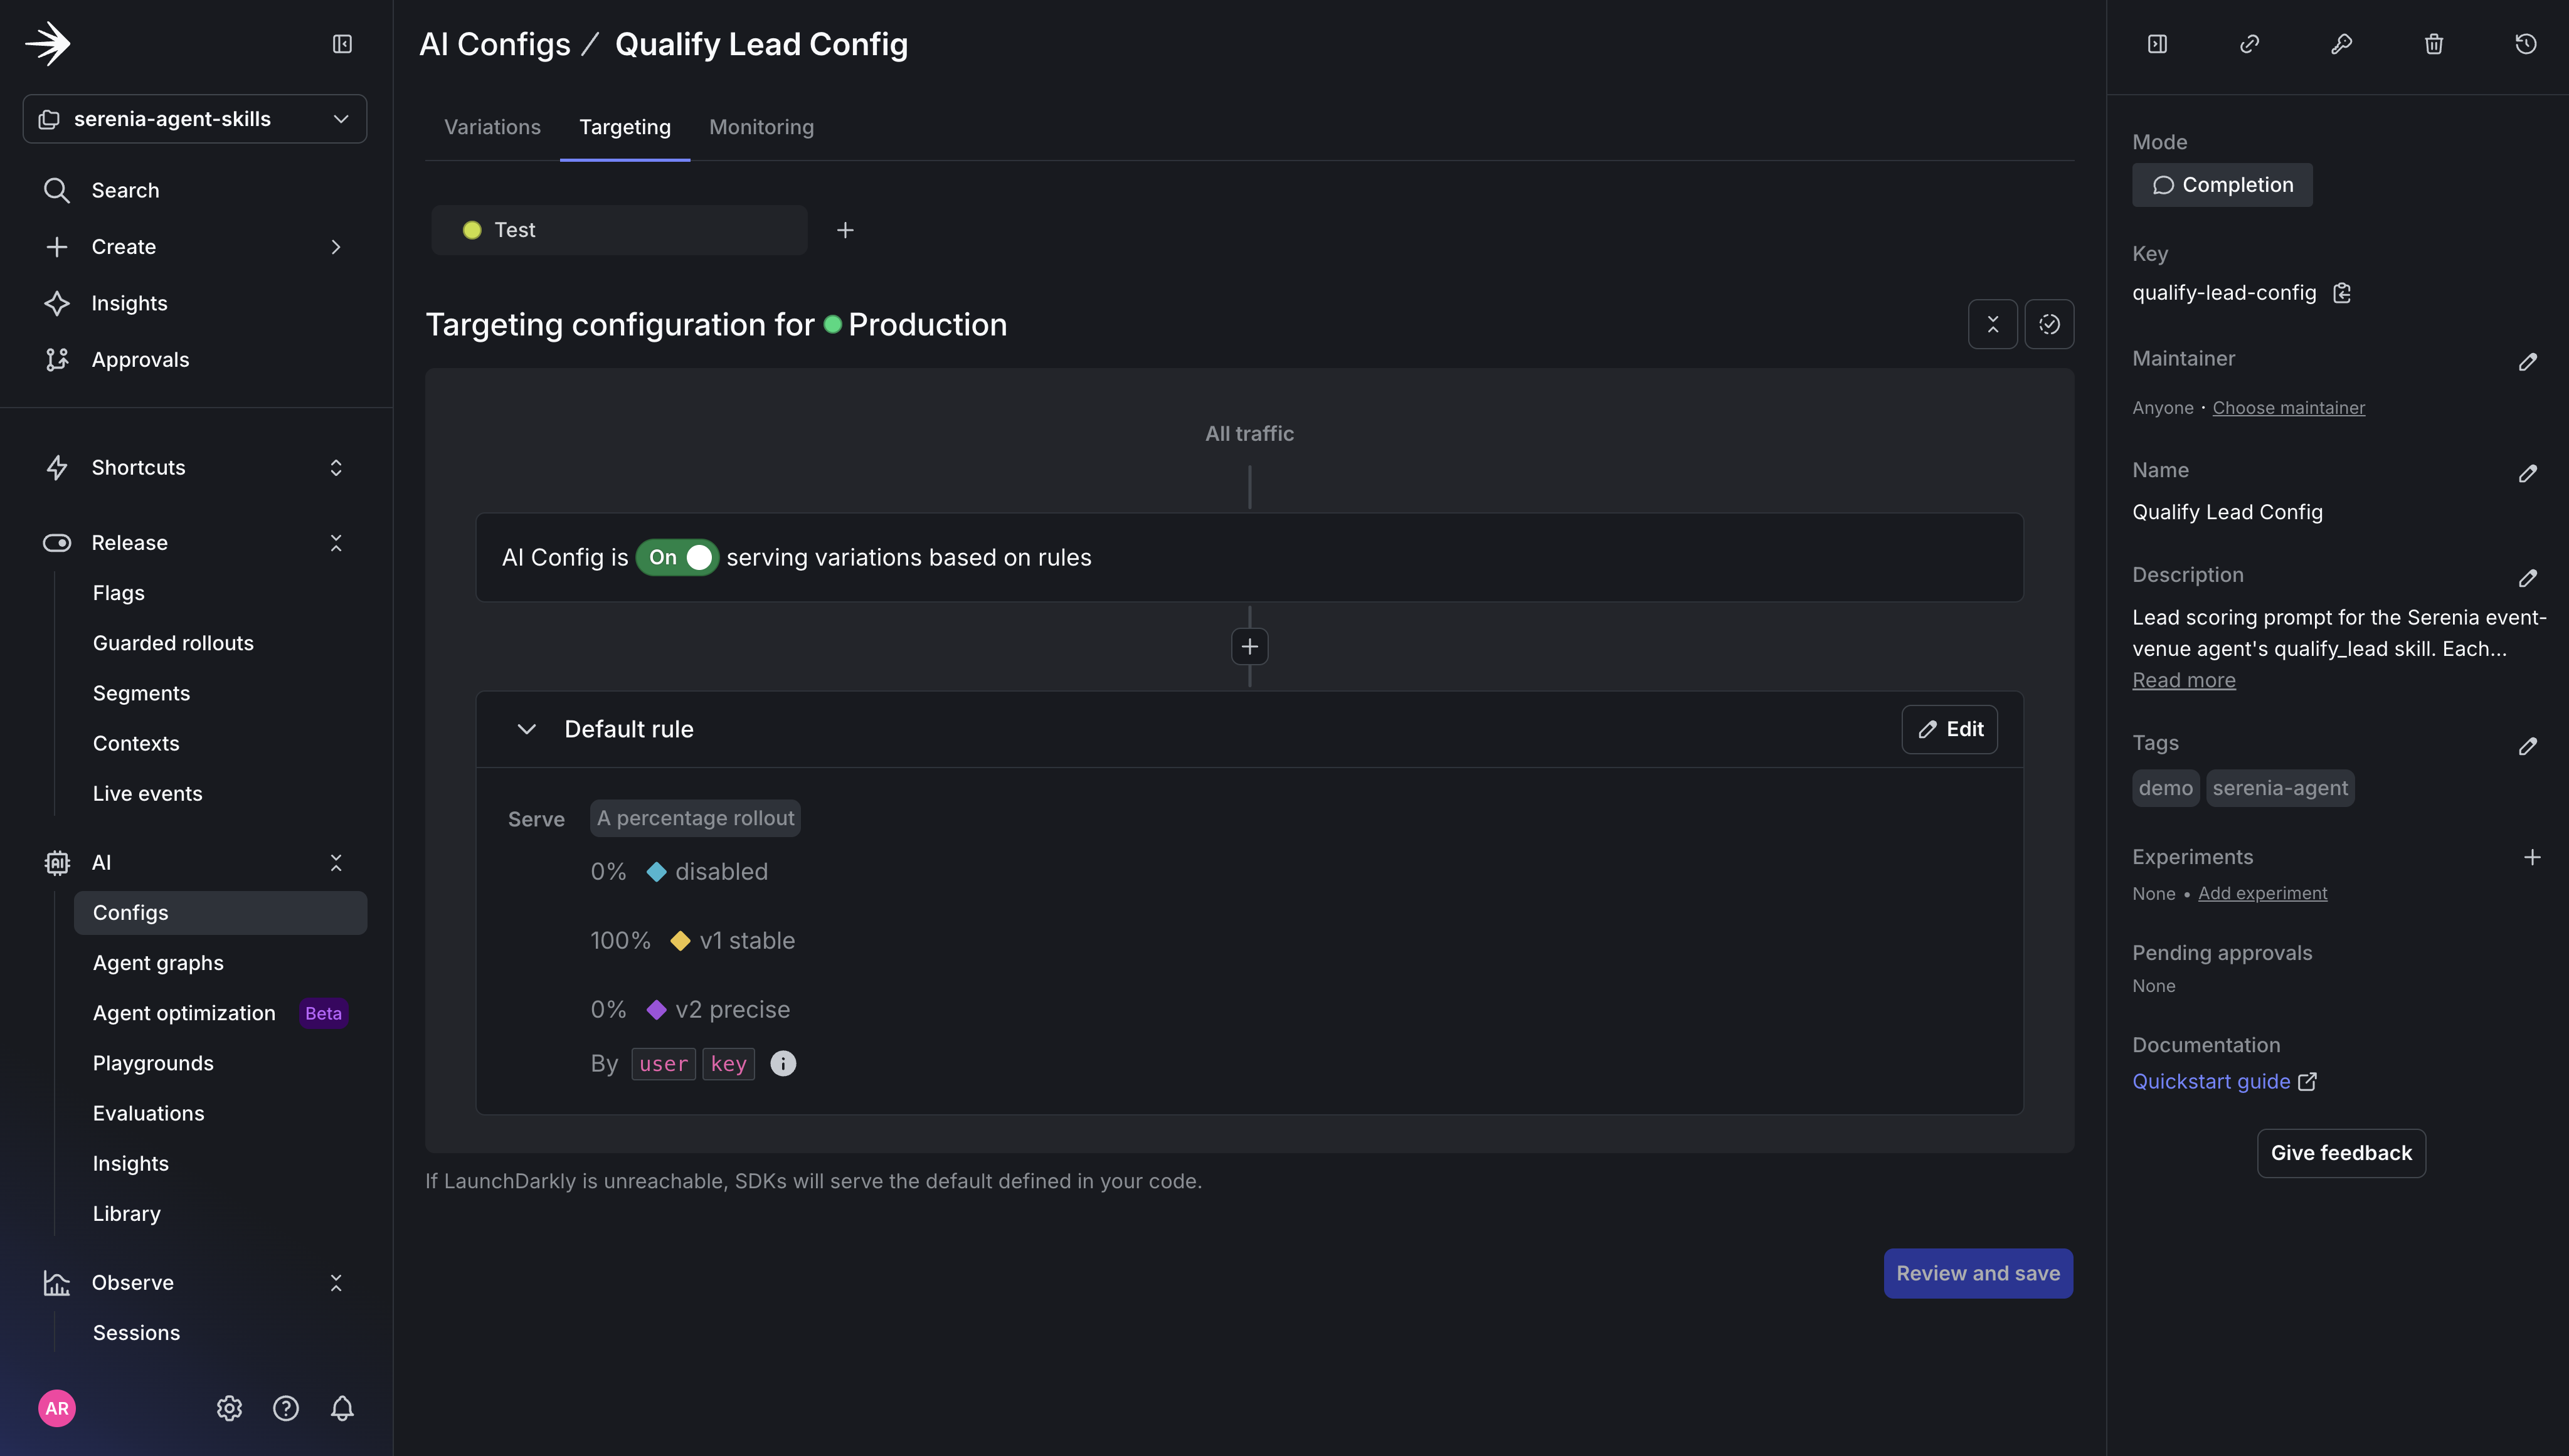
AgentControl configs, variations, targeting, percentage rollout
You’ll want a way to test how different variations impact traffic, but first you’ll need to create an AgentControl config for the qualify_lead skill to determine if the request is hot, warm, or cold.
You’ll also need to create two variations. The first uses the original JSON shape:
The second variation introduces a breaking JSON shape that adds three new variables not recognized by the parser contract:
LaunchDarkly’s AI configs product was renamed to AgentControl this week. The MCP server endpoints, slash commands, and some skill names still use the aiconfigs slug, and the resource itself is still commonly called an “AI config.” This tutorial uses the current product name (AgentControl) and keeps the legacy slugs in code and commands where they still apply.
Create the AgentControl config and two variations
Use the prompt below in Claude Code with the LaunchDarkly MCP server connected. It scaffolds the project, the AgentControl config, and both variations in a single pass.
Cursor / Claude Code prompt — create AgentControl config and variations
Result:
You can now create a percentage rollout in Agents → Configs. Under the AgentControl config you created, click Targeting with v1 set to 100% and v2 to 0% of traffic.
In the LaunchDarkly UI under Telemetry → Alerts, create the alert that will trigger an error at a given threshold.
Auto remediation will be set to off. If on, Vega would automatically investigate the issue, but for this tutorial you want to be able to investigate the issue yourself.
Then, generate baseline traffic to make sure observability data is coming in.
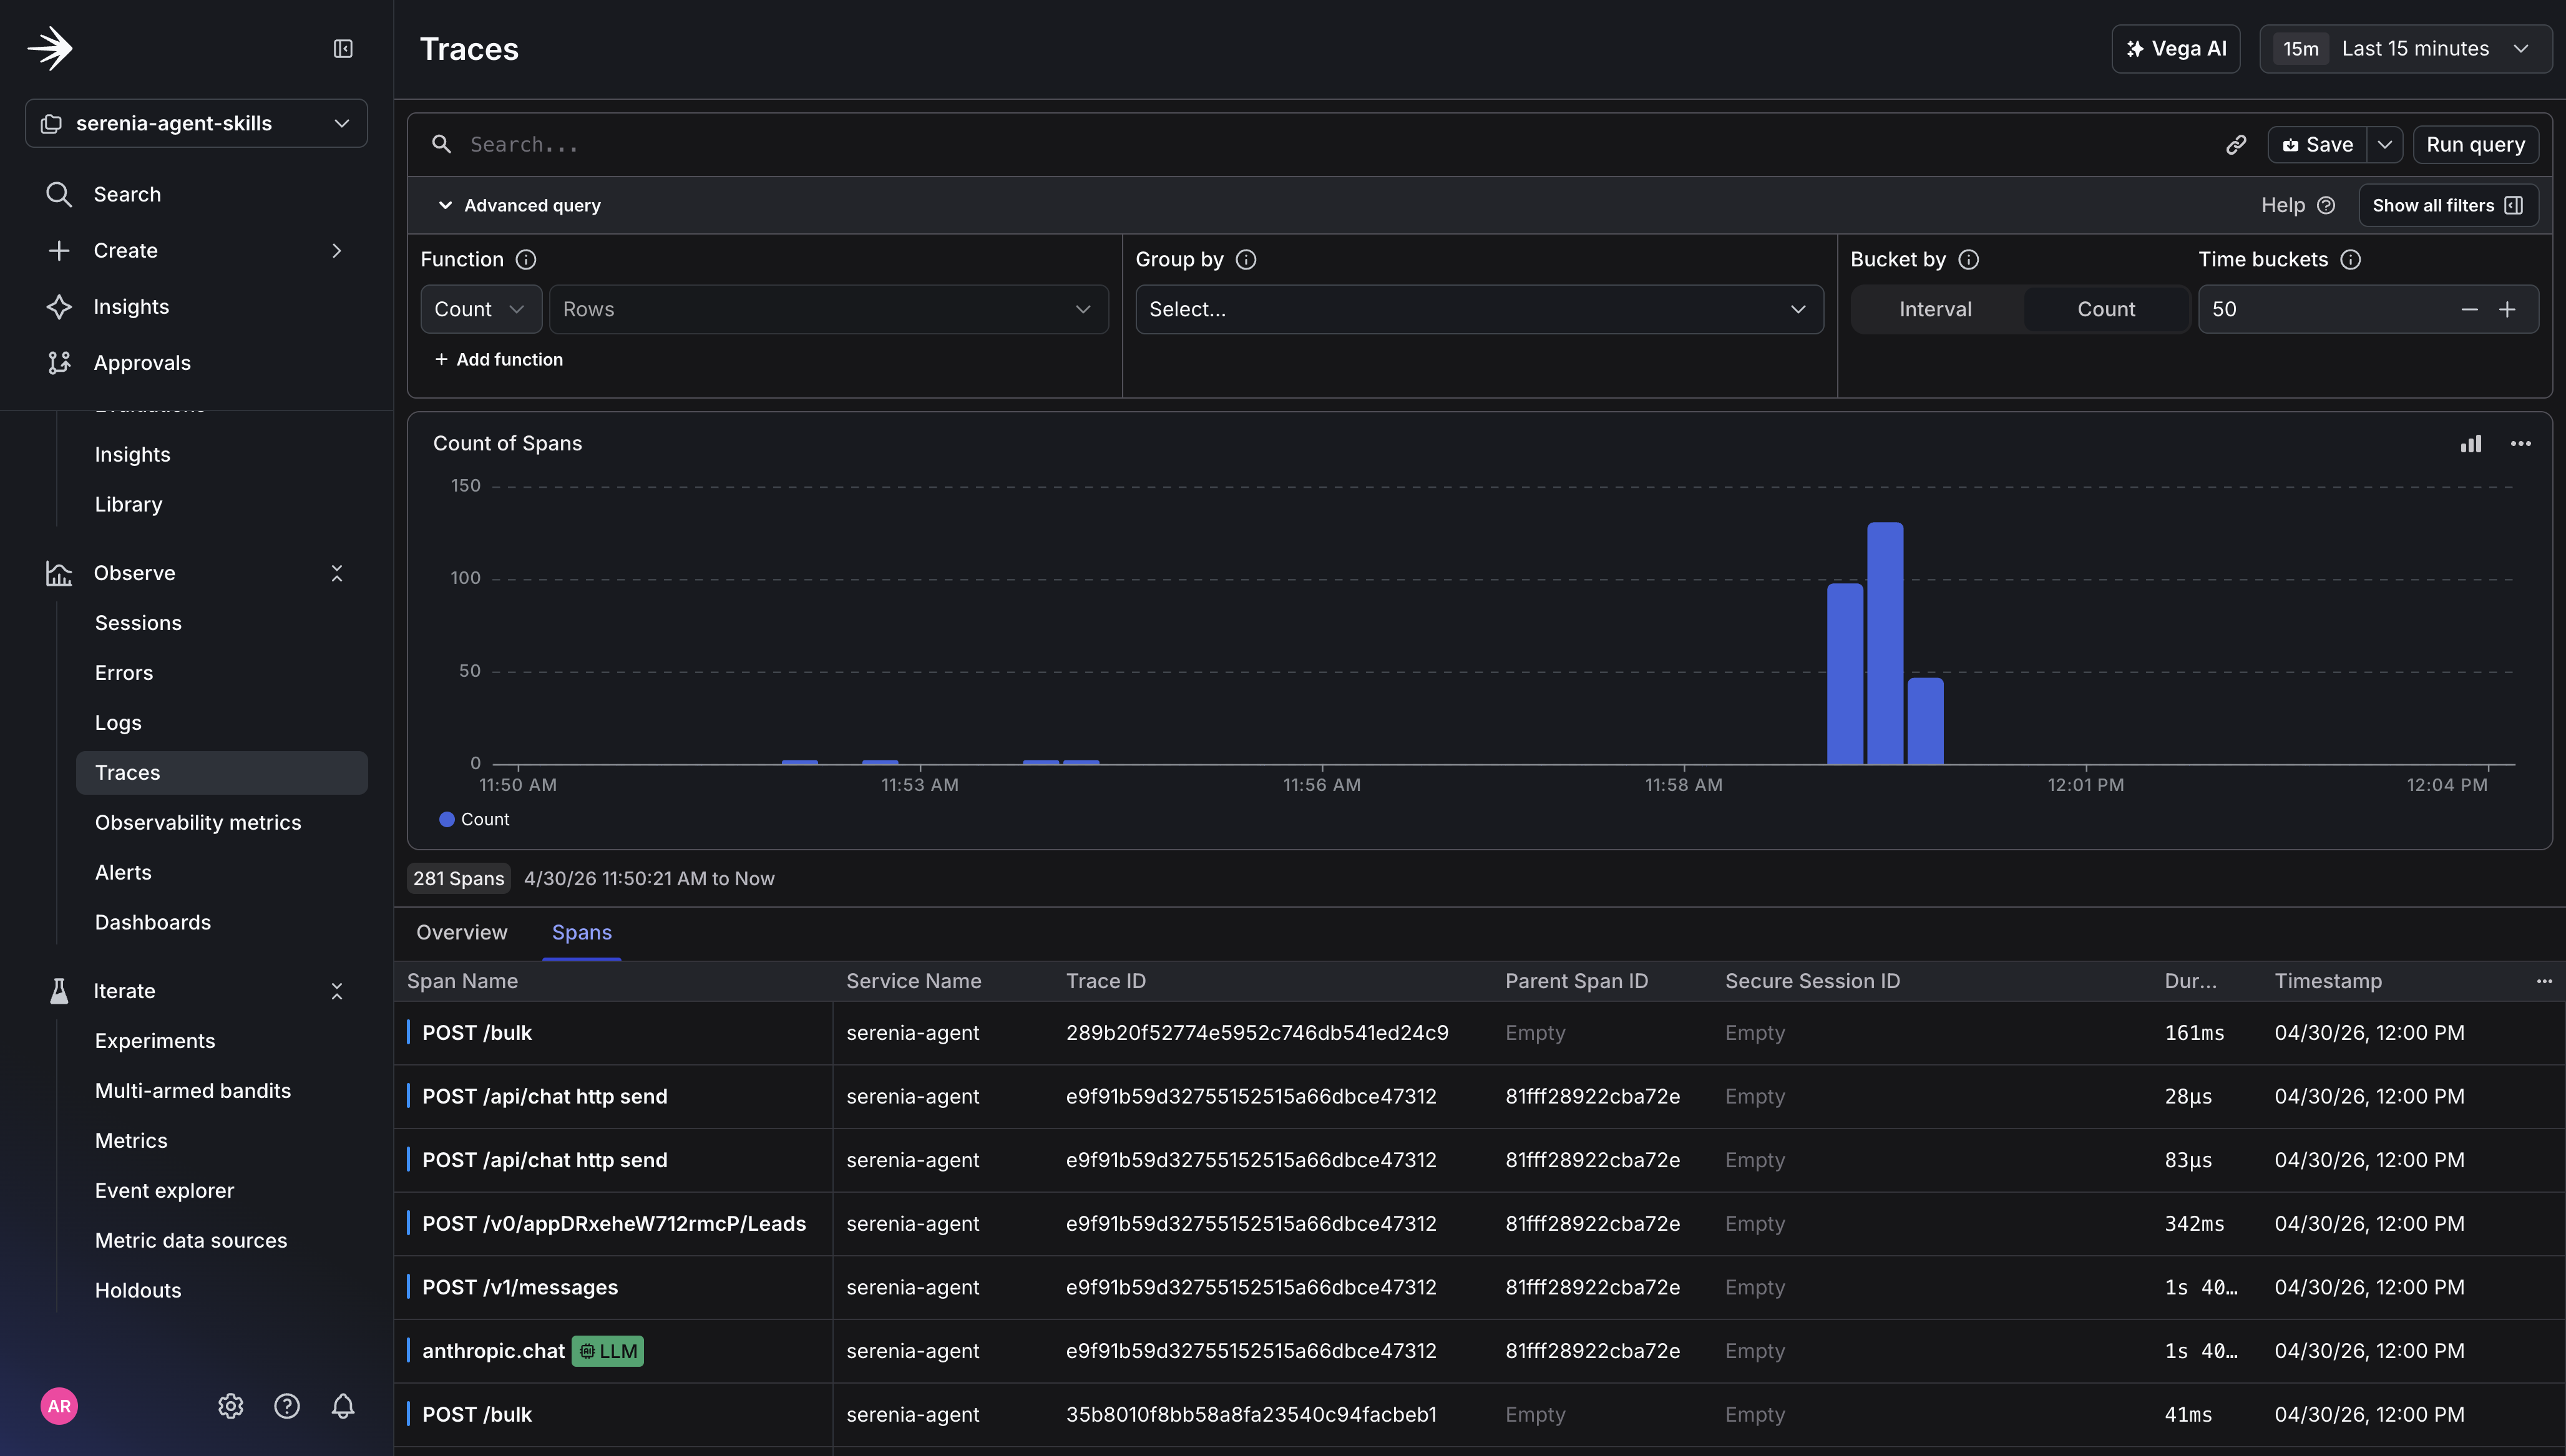
Baseline traffic output
Traces View:
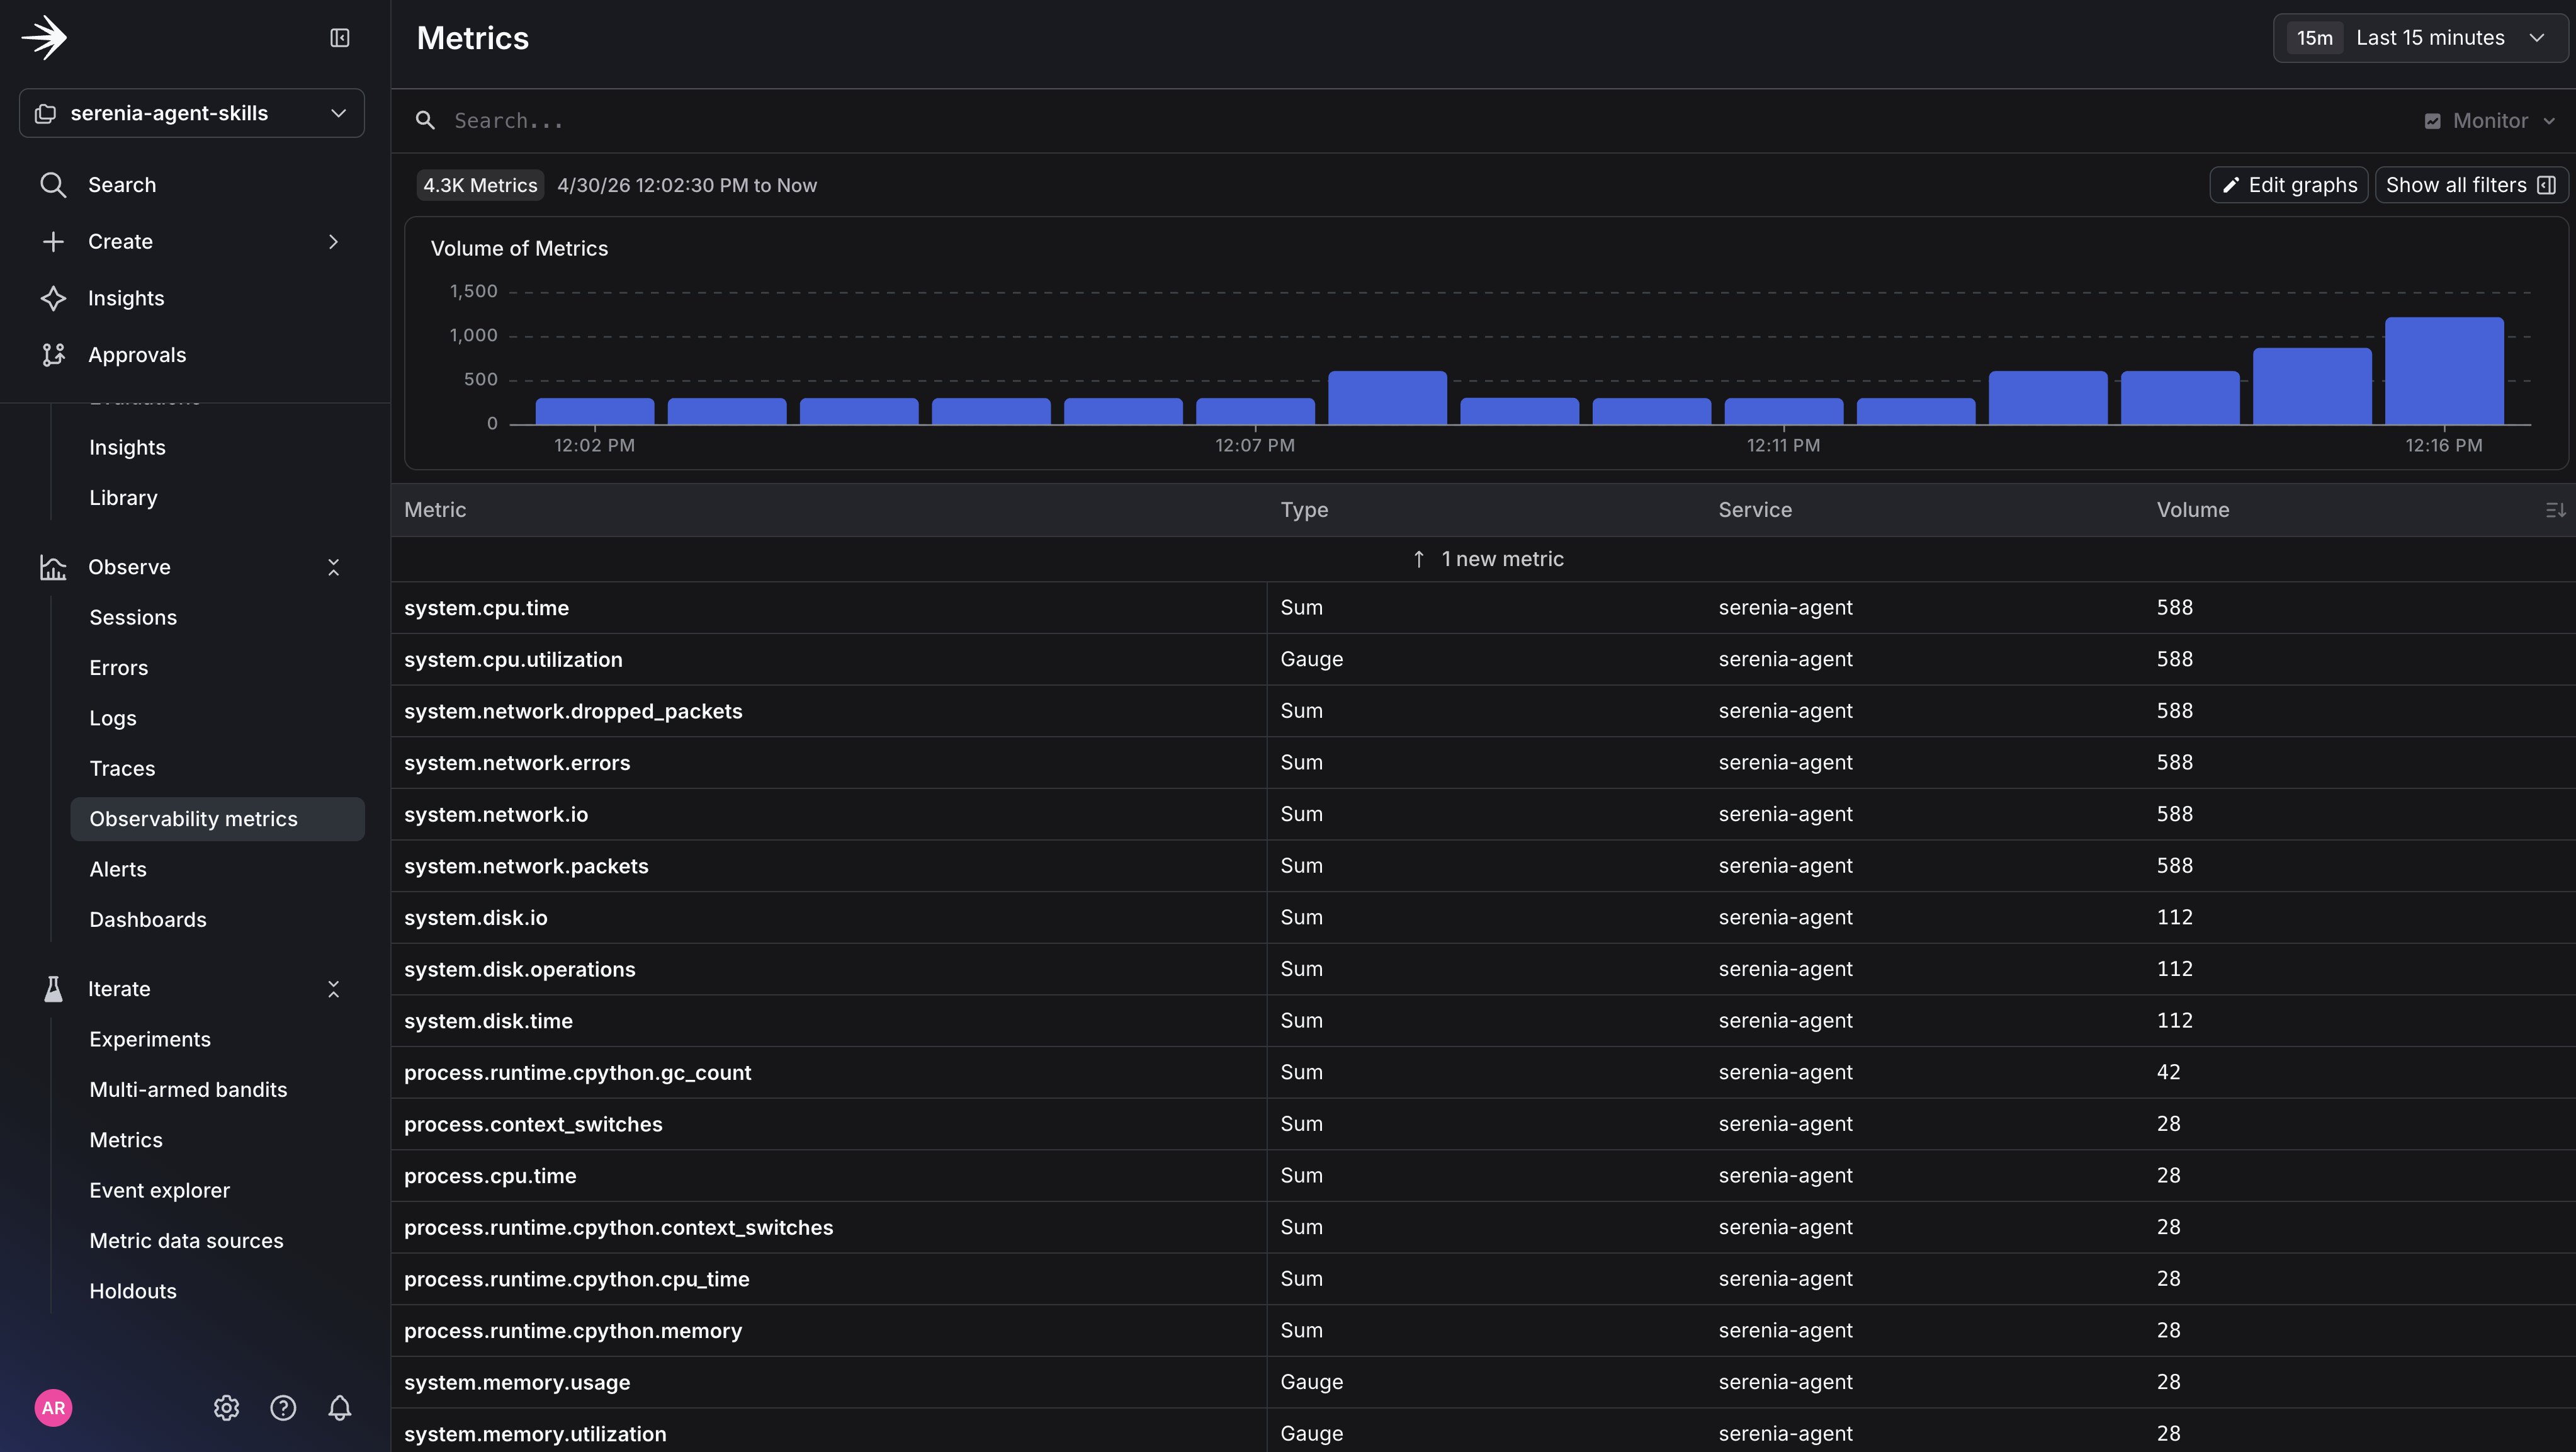
Metrics View:
Now, let’s test the breaking change by shifting variation percentages to v1 → 75% and v2 → 25%.
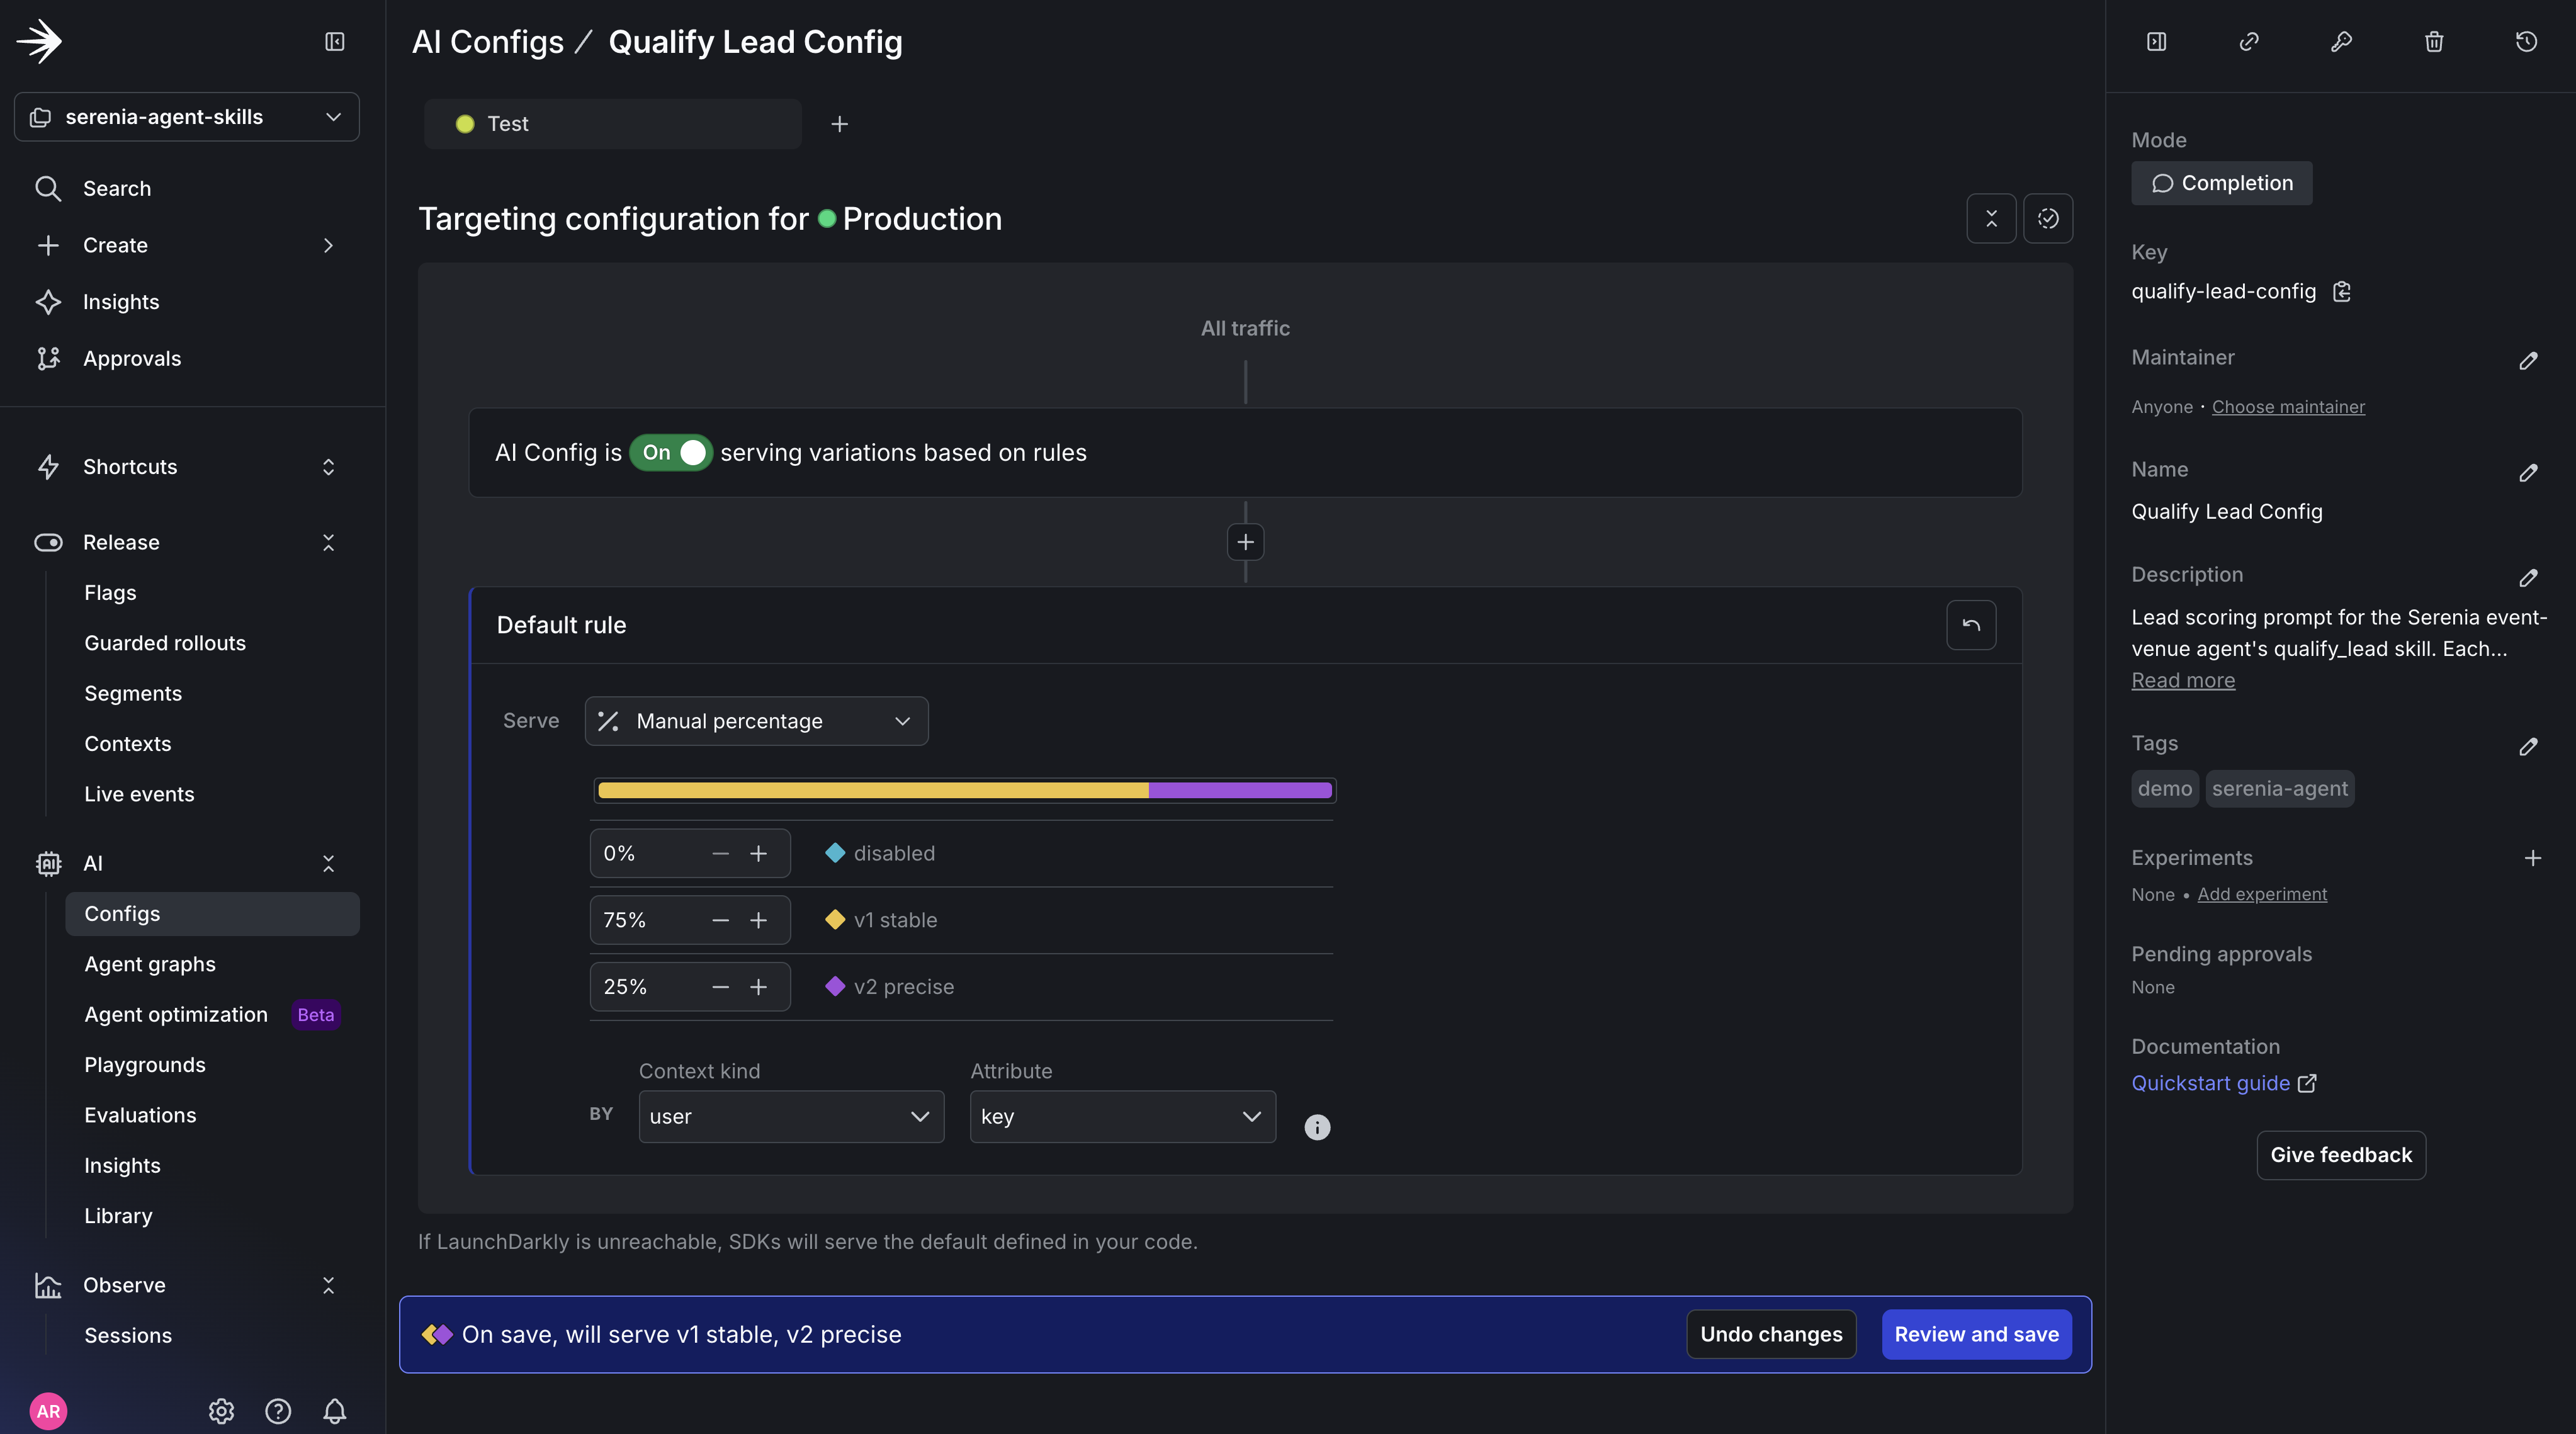
This will shift 25% of traffic to variation 2, which injects a new JSON shape into the system prompt.
Send requests so the new v2 variation gets exercised:
Traffic output with v2 errors
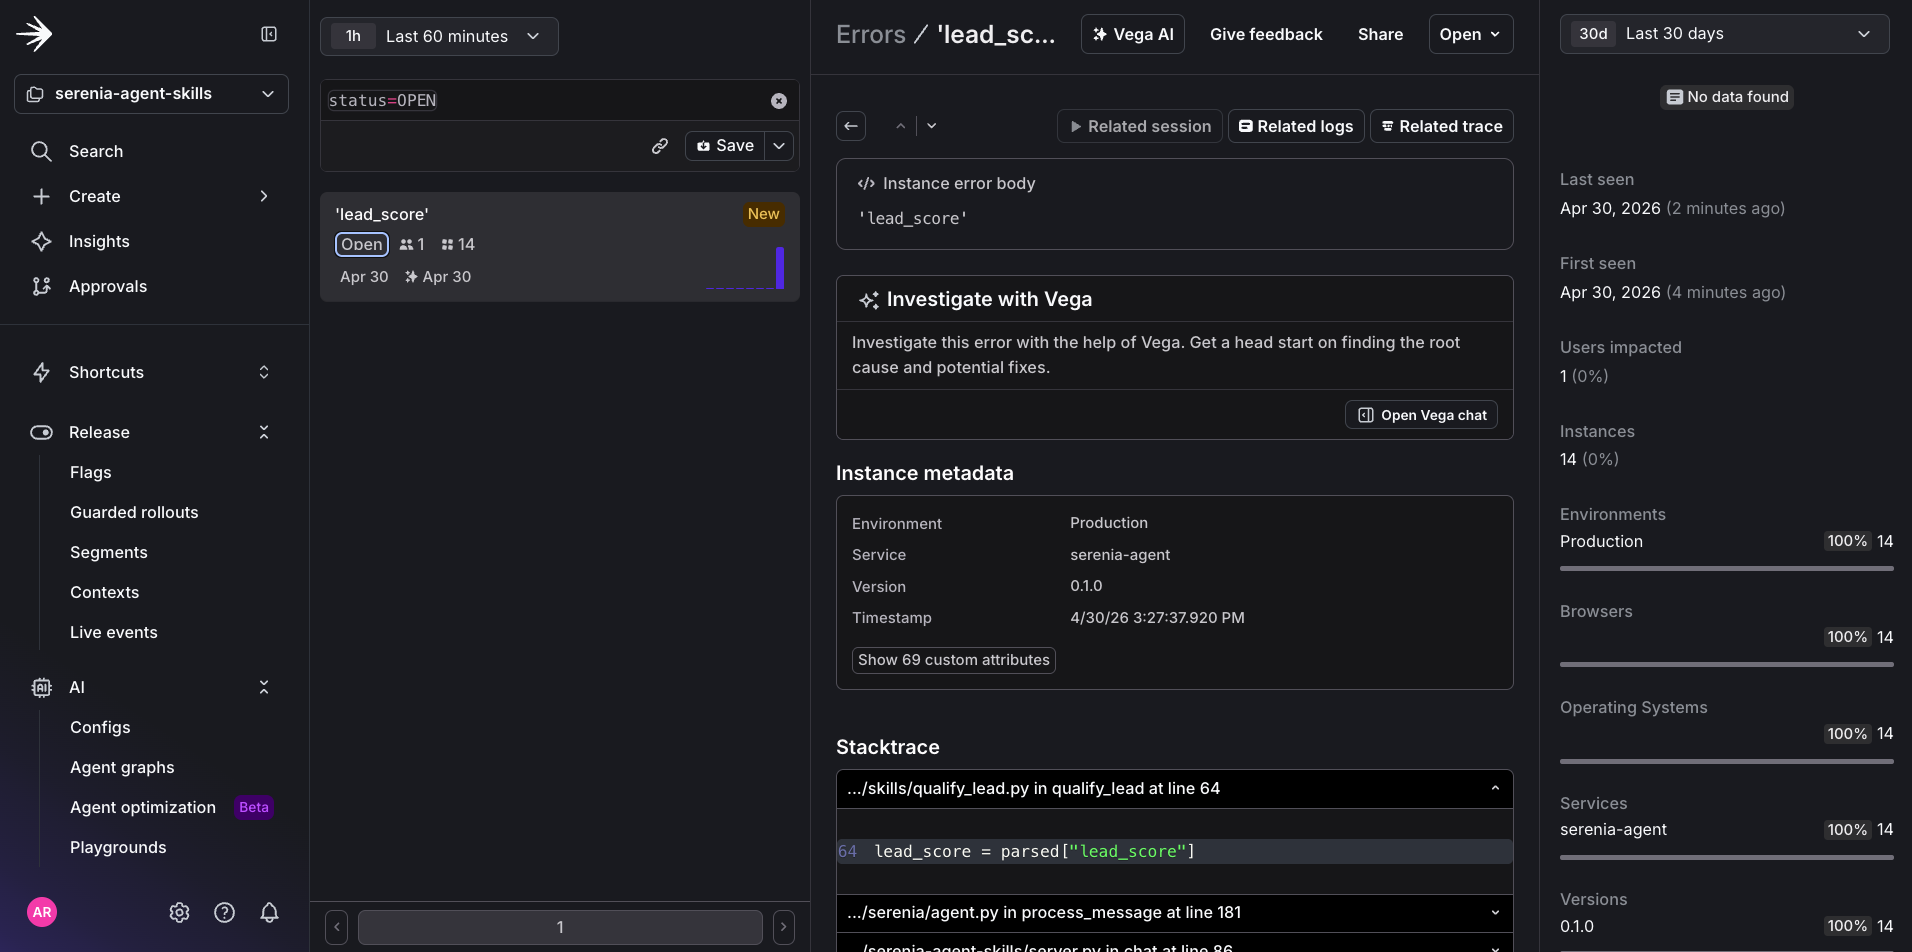
If you navigate to Telemetry → Errors, you’ll be able to see the error picked up by the alert you created.
Investigation — five prompts
This is the step where you could use Vega to handle investigation, but sometimes you may want to drill down yourself and use AI to get to the root cause sooner. For this scenario, you can use these five prompts in Claude Code to diagnose the issue now that the alert has been triggered. You can also run this same investigation in your own AI agent by connecting the LaunchDarkly MCP server — the prompts below work in any agent with the MCP connected.
Prompt 1 — Scope the blast radius
Result:
This first prompt does what a human would do clicking through a dashboard, except faster and with the synthesis already written. It establishes when the spike began, how many sessions and users are hit, which skill is responsible, and what the error fingerprint looks like.
Prompt 2 — Reconstruct a user session failure
Result:
With this output, you’re able to put yourself in the user’s shoes and see exactly what feature might have caused the issue. In this case the error is occurring at the lead_score stage of the qualify_lead agent skill.
Prompt 3 — Pinpoint the type of breaking change
Result:
Prompt 4 — Confirm the variation is the cause
Result:
This is the prompt that turns a hypothesis into a diagnosis. The previous prompt established correlation in time; this one establishes correlation in cohort. Together they’re enough to make a confident decision.
Prompt 5 — Finalize what’s different
Result:
The fifth prompt closes the loop. You started with an alert that said “error count is up.” You end with a one-sentence root cause and two specific remediation paths, with the agent volunteering an opinion on which is faster. This is where the human in the loop is needed just in time to act on the suggested root cause and remediation steps.
The Decision
Now that you have the diagnosis, there are three plausible paths forward, and each one is a real option an on-call engineer might pick.
- Roll back
qualify-lead-v2-preciseto 0% and serve everyonequalify-lead-v1-stablewhile the parser is fixed. Fastest, blunt, and stops the bleeding immediately. Downside: any benefit from the new prompt’s richer scoring (urgency, budget signal, decision authority) is paused until the parser catches up. - Hold the rollout at 25% while you patch the parser to read
lead_temperature. The error count stays elevated for ~25% of leads until the patch ships, but you don’t yo-yo the variation in a way that complicates the audit trail. - Patch and ship forward without rolling back at all. Correct fix, slowest, requires confidence that the parser update will land in the next thirty minutes. If you’re already on
qualify_lead.pyin another PR, this might be cheaper than it looks.
The MCP server gave you the evidence. You give the order. To turn the diagnosis into communication, run one more prompt: