Day 6 | 💸 The famous green character that stole your cloud budget: the cardinality problem
Day 6 | 💸 The famous green character that stole your cloud budget: the cardinality problem
Published December 15, 2025

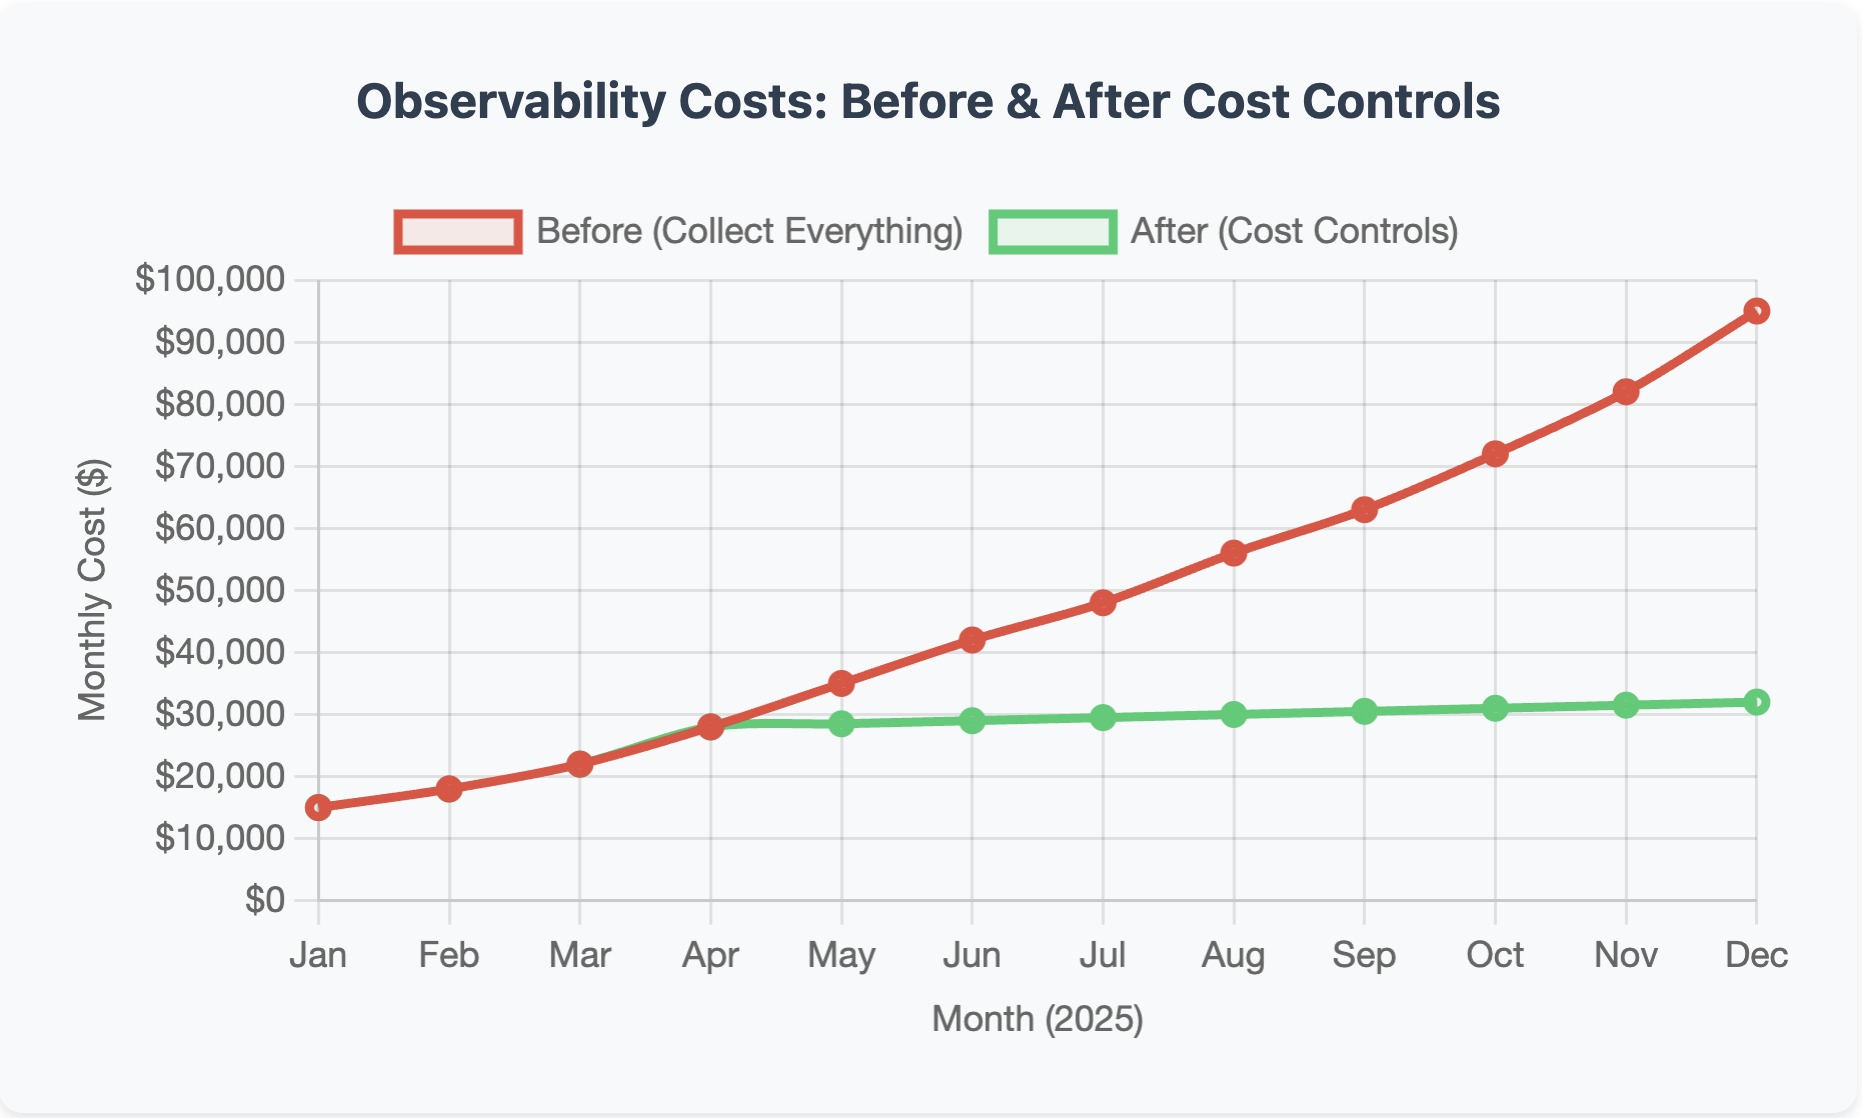
Every December, engineering teams unwrap the same unwanted gift: their annual observability bill. And every year, it’s bigger than the last.
You know the pattern. Services multiply. Traffic grows. Someone discovers OpenTelemetry and suddenly every microservice is emitting 50 spans per request instead of 5. Then January rolls around and your observability platform sends an invoice that’s 30% higher than last quarter.
Your VP of Engineering wants to know why.
You could blame it on the famous green character who hates Christmas, or you could join other teams who are getting serious about cost-efficient observability. That is, collecting telemetry data based on value, not volume.
Why “collect everything” no longer works
The old playbook was simple: instrument everything, store it all, figure out what you need later. Storage was cheap enough. Queries were fast enough. No need to overthink it.
Then, three things happened:
- OpenTelemetry went mainstream. Teams migrated from vendor agents to OTel and began adding spans for everything. This added more visibility, but with 10x the data.
- AI observability tools arrived. Platforms started using LLMs to analyze traces and suggest root causes. Powerful, but also expensive to run against terabytes of unfiltered trace data.
- CFOs started asking questions. “Our_traffic grew 15% but observability costs grew 40%. Explain.”
To stop instrumenting wouldn’t be an option and also you want to make informed decisions, but still the biggest culprit, hiding in your telemetry stack is cardinality.
Cardinality will eat your budget
Cardinality is the observability villain. It sneaks in quietly, one innocent-looking label at a time, and before you know it, it’s stolen your entire cloud budget. What is cardinality? It’s just the number of unique time series your metrics generate, but it’s also the main driver of observability costs that nobody sees coming.
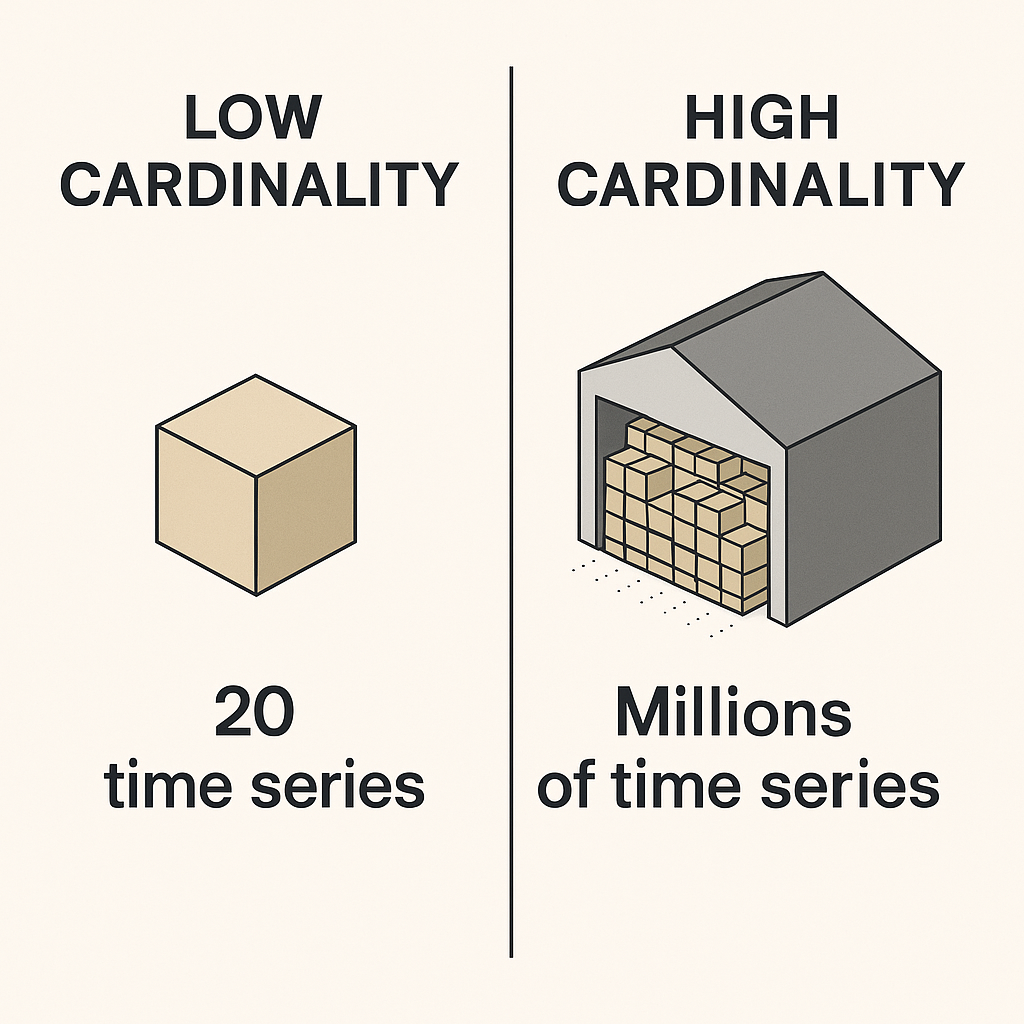
Low cardinality: http_requests_total tracked by method and status_code. Maybe 20 unique combinations. Fairly manageable.
High cardinality: Same counter, but now you’ve added user_id, request_id, and session_token as labels. By simply adding these labels, you’ve just created millions of unique time series. Each one needs storage, indexing, and query compute. This will compound your bill faster than you can say deck the halls, except you wouldn’t be able to deck the halls, you’d be paying off your usage bill.
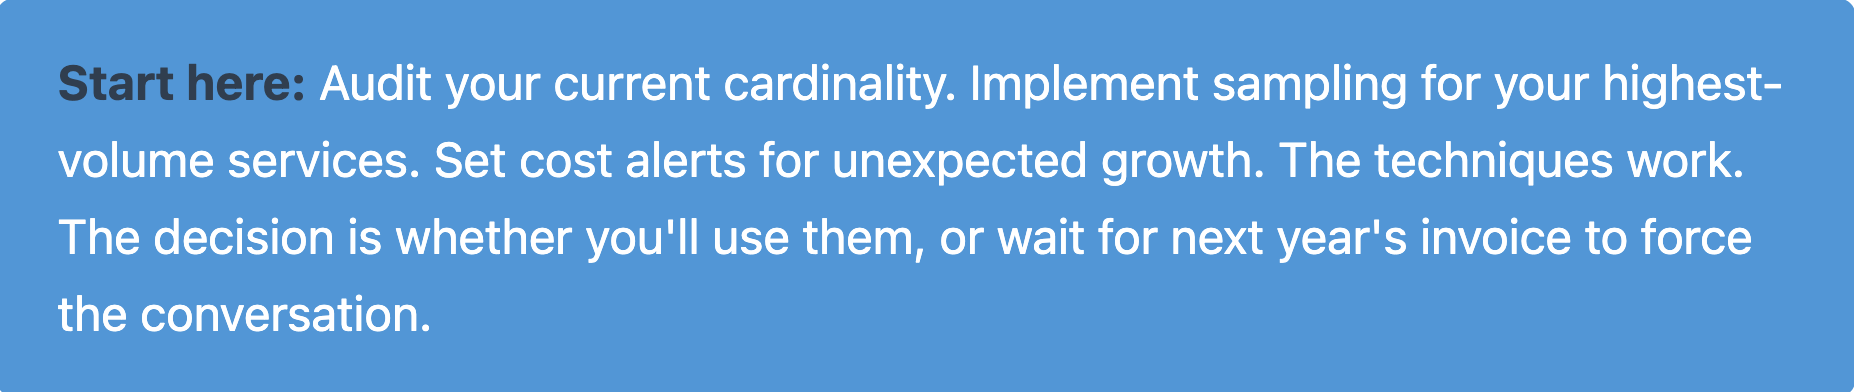
Stopping the Green character: set cardinality budgets
Most teams don’t set limits on how many time series a service can create even though they should., but you can.
Start by auditing what you’re currently generating. Look for metrics with >100K unique time series, or labels that include UUIDs, request IDs, or email addresses. These are your problem children.
Then set budgets. Give each service a limit, like 50K time series max. Assign team quotas so the checkout team knows they get 200K total across all their services. Create attribute allowlists that define exactly which labels are allowed in production. Yes, this feels restrictive at first. Your developers will complain. They’ll argue that they need that user_id label for debugging. And sometimes they’re right. But forcing that conversation up front means they have to justify the cost, not just add labels reflexively.
Finally, enforce budgets through linters that flag high-cardinality attributes in code review, CI checks that fail if estimates get too high, and dashboards that alert when cardinality spikes. This isn’t about being restrictive. It’s about being intentional. If you’re adding a label, you should know why and what it’ll cost.
Cardinality budgets solve the metrics problem, but what about traces? That’s where sampling comes in.
Sampling: without the guilt
Not all sampling strategies are created equal, and picking the right one depends on what you’re trying to protect.
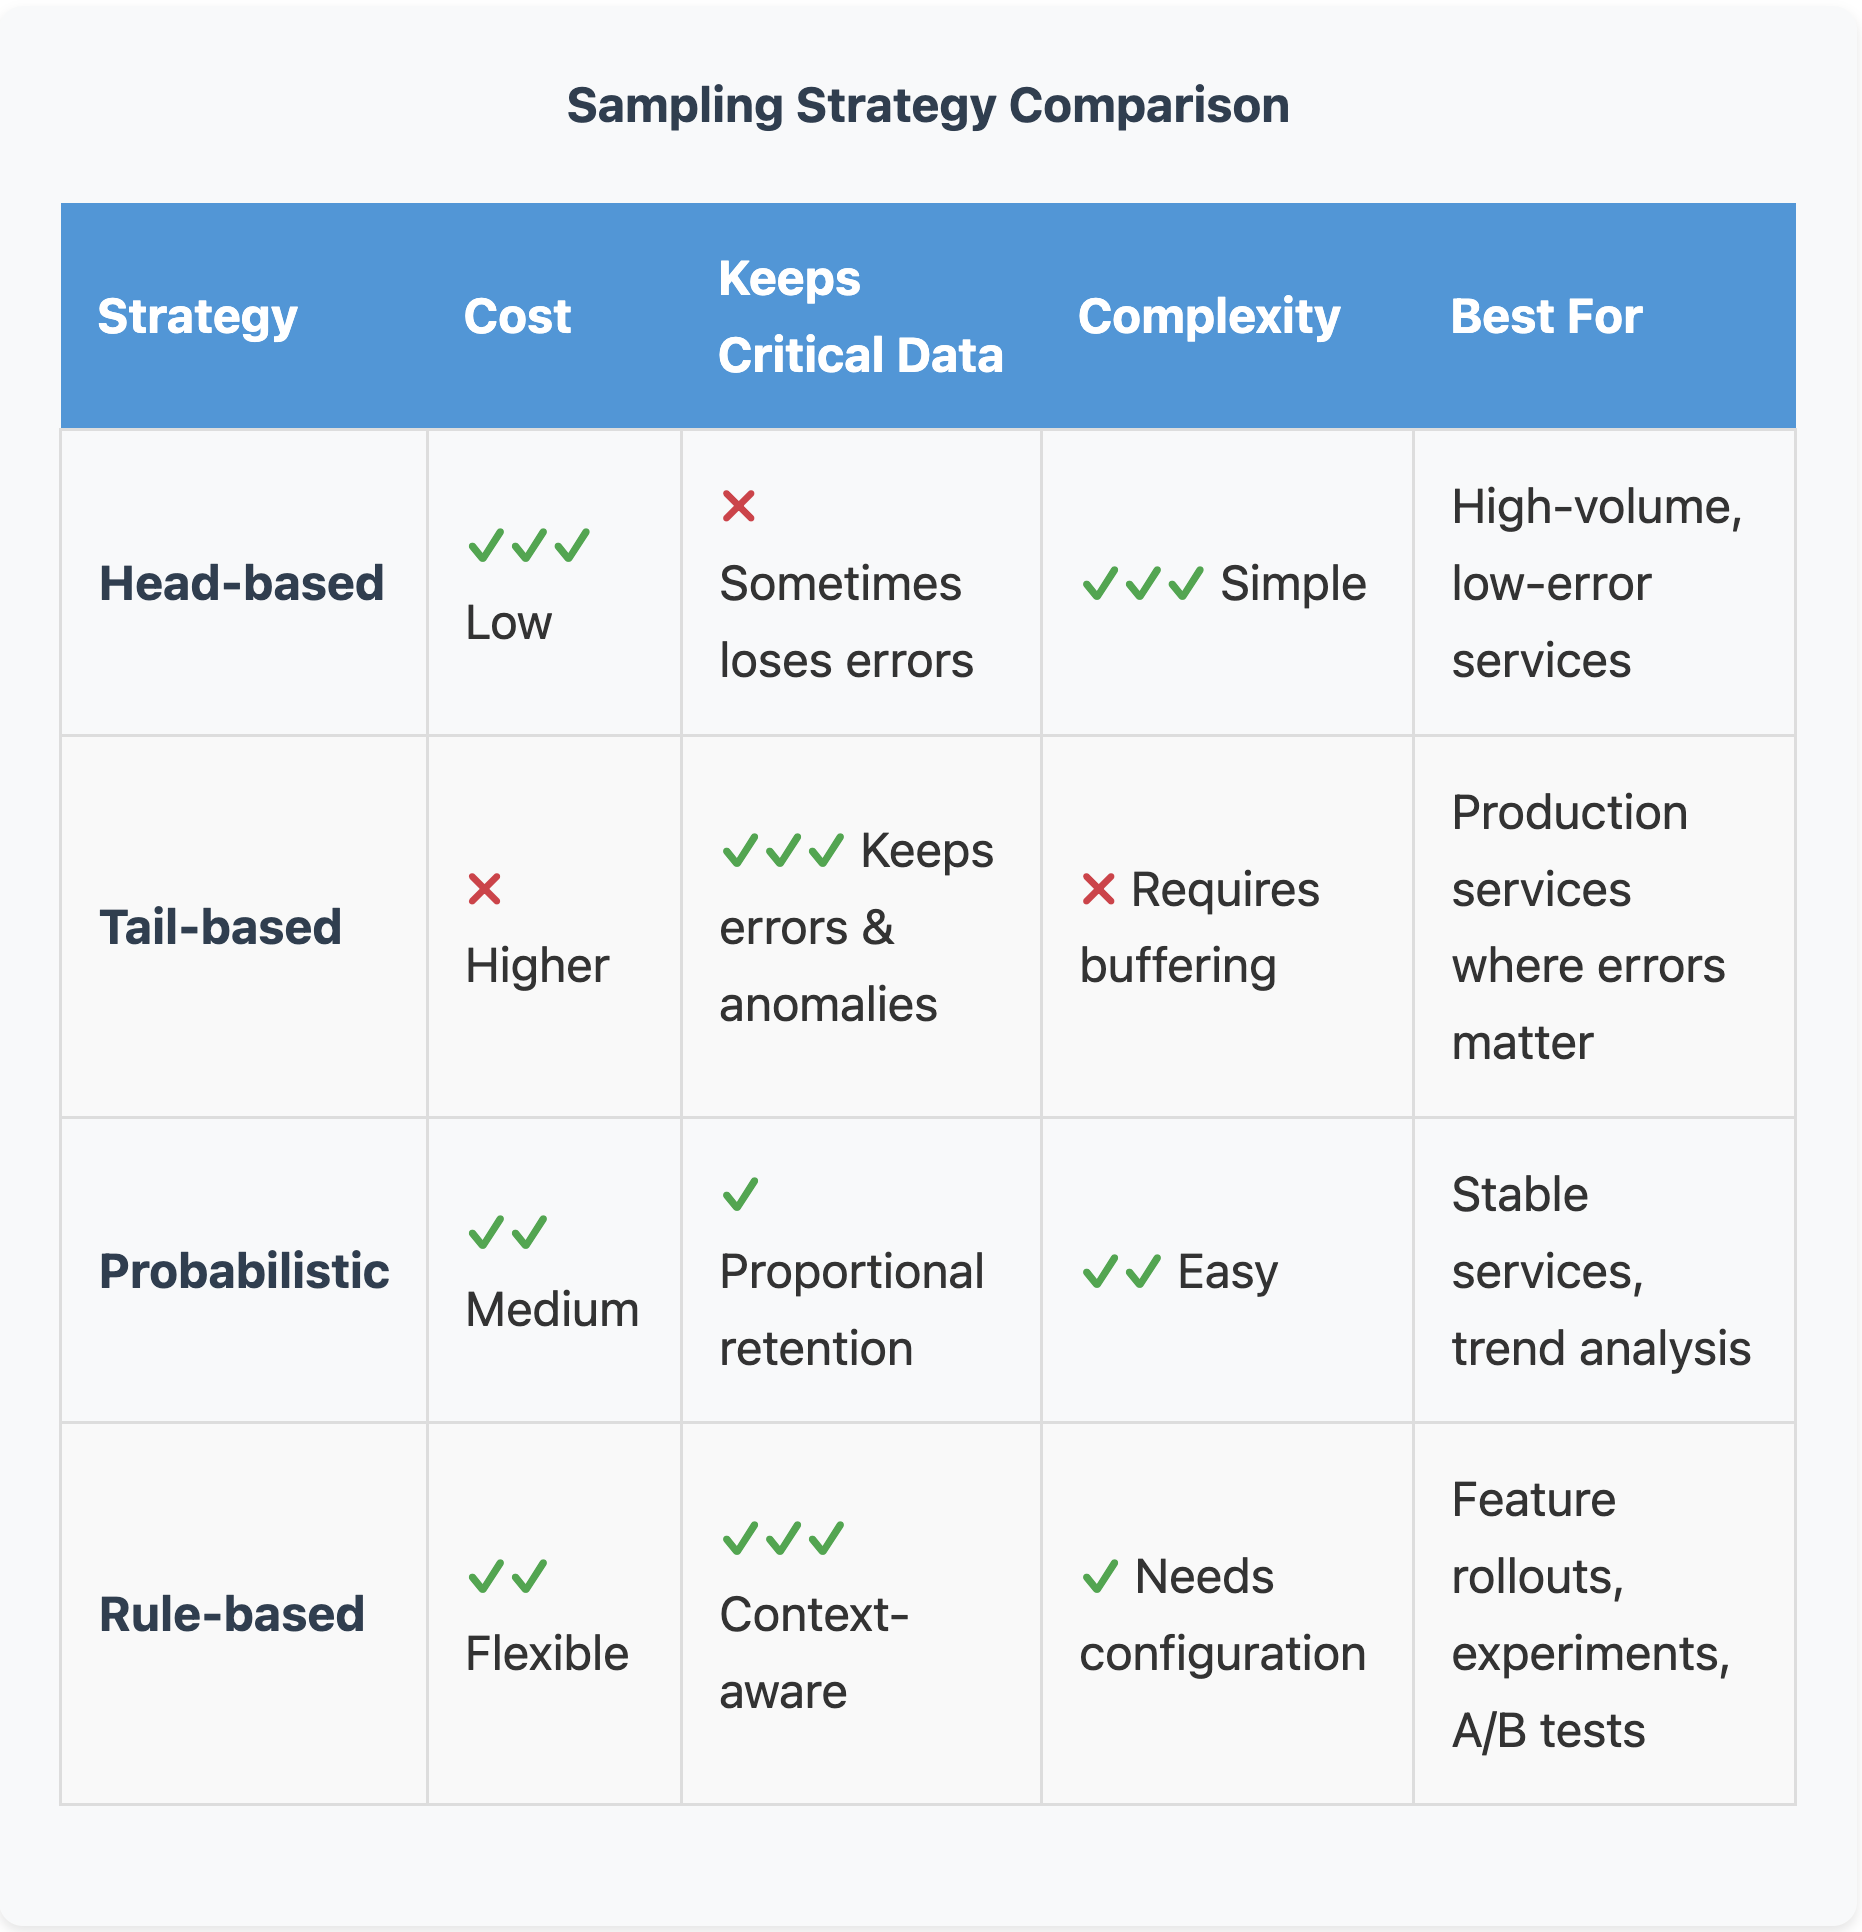
Head-based sampling is pretty strict. You decide whether to keep a trace at the very start of a request, before you know if it’ll be interesting. Fast checkout gets dropped. Slow checkout that timeout also gets dropped, because the decision happened too early. Not great.
Tail-based sampling is smarter. Wait until the trace completes, then decide based on what actually happened. Keep errors, high latency, or specific user cohorts. Sample down the boring stuff. This costs more (you have to buffer complete traces) but you keep what matters.
Probabilistic sampling is the middle ground. Keep 10% of everything, regardless of content. Predictable cost reduction, but you’ll still lose some critical events. Works fine for stable services where trends matter more than individual traces.
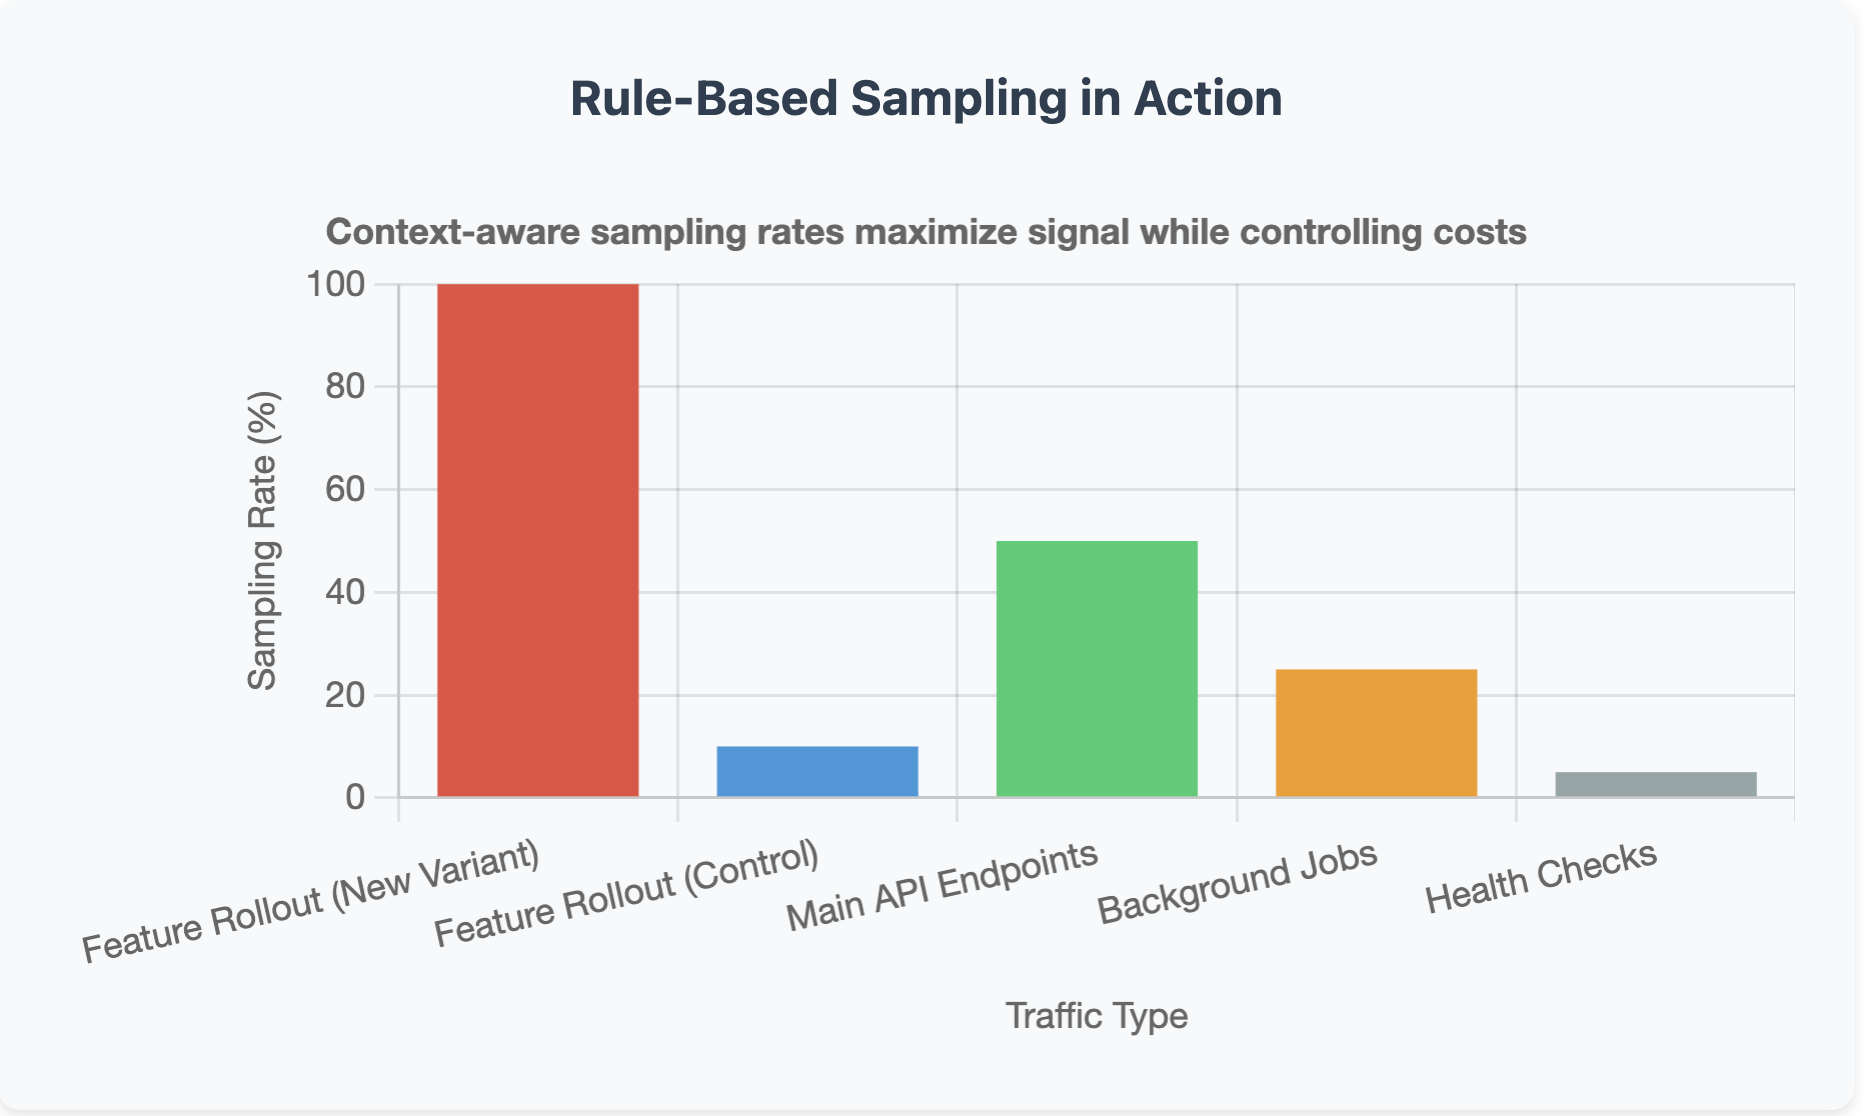
Now rule-based sampling is where things get interesting, and honestly where most teams should be spending their energy. The idea is dead simple: different traffic deserves different sampling rates. You keep 100% of traces during feature rollouts because you actually care about every request when you’re validating a new flow.
If you’re using LaunchDarkly for progressive rollouts, you can tie sampling rates directly to flag evaluations. 100% sampling for users in the new variant, 10% for the control group. Your main API endpoints can run at 50% since they’re stable and high-volume. Internal health checks that just verify the service is alive need maybe 5%, or even less. I’ve seen teams go down to 1% for health checks and never miss it.
The key is that you’re making these decisions based on the actual value of the signal, not just applying a blanket rate across everything. Adjust based on context: feature flags, experiments, specific endpoints, user cohorts, whatever makes sense for your system.
Sampling isn’t about compromising visibility. It’s about amplifying signals. The noisy 90% of traces you’re storing never get looked at anyway.
Once you’ve decided what to keep, you still need to decide how long to keep it and at what resolution.
Downsample vs. Discard: know when to do which
Not all data reduction is the same, and mixing up downsampling with discarding is how teams accidentally delete data they actually need.
Downsample when you need historical context but not full precision. SLO burn rates don’t need second-by-second granularity so you can downsample to 1-minute intervals and still catch every trend. An additional practice is to keep high-res data for a week, then downsample to hourly for long-term retention.
Discard when the data is redundant or has served its purpose. For instance, debug spans from a canary that passed three days ago can be deleted. Or if you captured an error in both a trace and a log, you can pick one source of truth and drop the duplicate.
The rule of thumb here is If you’ll never query it, don’t store it. If you might need it for trends in six months, downsample it. If you need it immediately when something breaks, keep it at full resolution with an aggressive retention policy.
What this actually looks like
Cost-efficient observability isn’t about cutting capabilities. It’s about cutting waste.
Start by auditing your cardinality. Find the metrics generating hundreds of thousands of time series because someone added user_id as a label. Then, set budgets like 50K per service, 200K per team and enforce them through linters and CI checks. Create ways to encourage developers to justify high-cardinality labels before they ship, not after the bill arrives.
Then you’ll be ready to tackle sampling. Drop the blanket 10% probabilistic rate and switch to rule-based sampling tied to actual value. Keep 100% of traces during feature rollouts. Sample stable endpoints at 10%. Go as low as 1% for health checks. If you’re running feature flags, tie sampling to flag evaluations so you capture what matters and discard what doesn’t.
Finally, clean up retention, downsample SLO metrics to 1-minute intervals, discard debug spans from canaries that passed days ago and delete duplicate error data.
This not only leads to lower bills, but also cleaner dashboards, faster queries, fewer noisy alerts, and teams that spend less time swimming through telemetry and more time fixing actual problems.
Observability ROI isn’t measured in data volume. It’s measured in how fast you detect and resolve issues.
The teams figuring this out in 2025 aren’t collecting everything. They’re collecting what matters.