

Understanding the Observability Tree
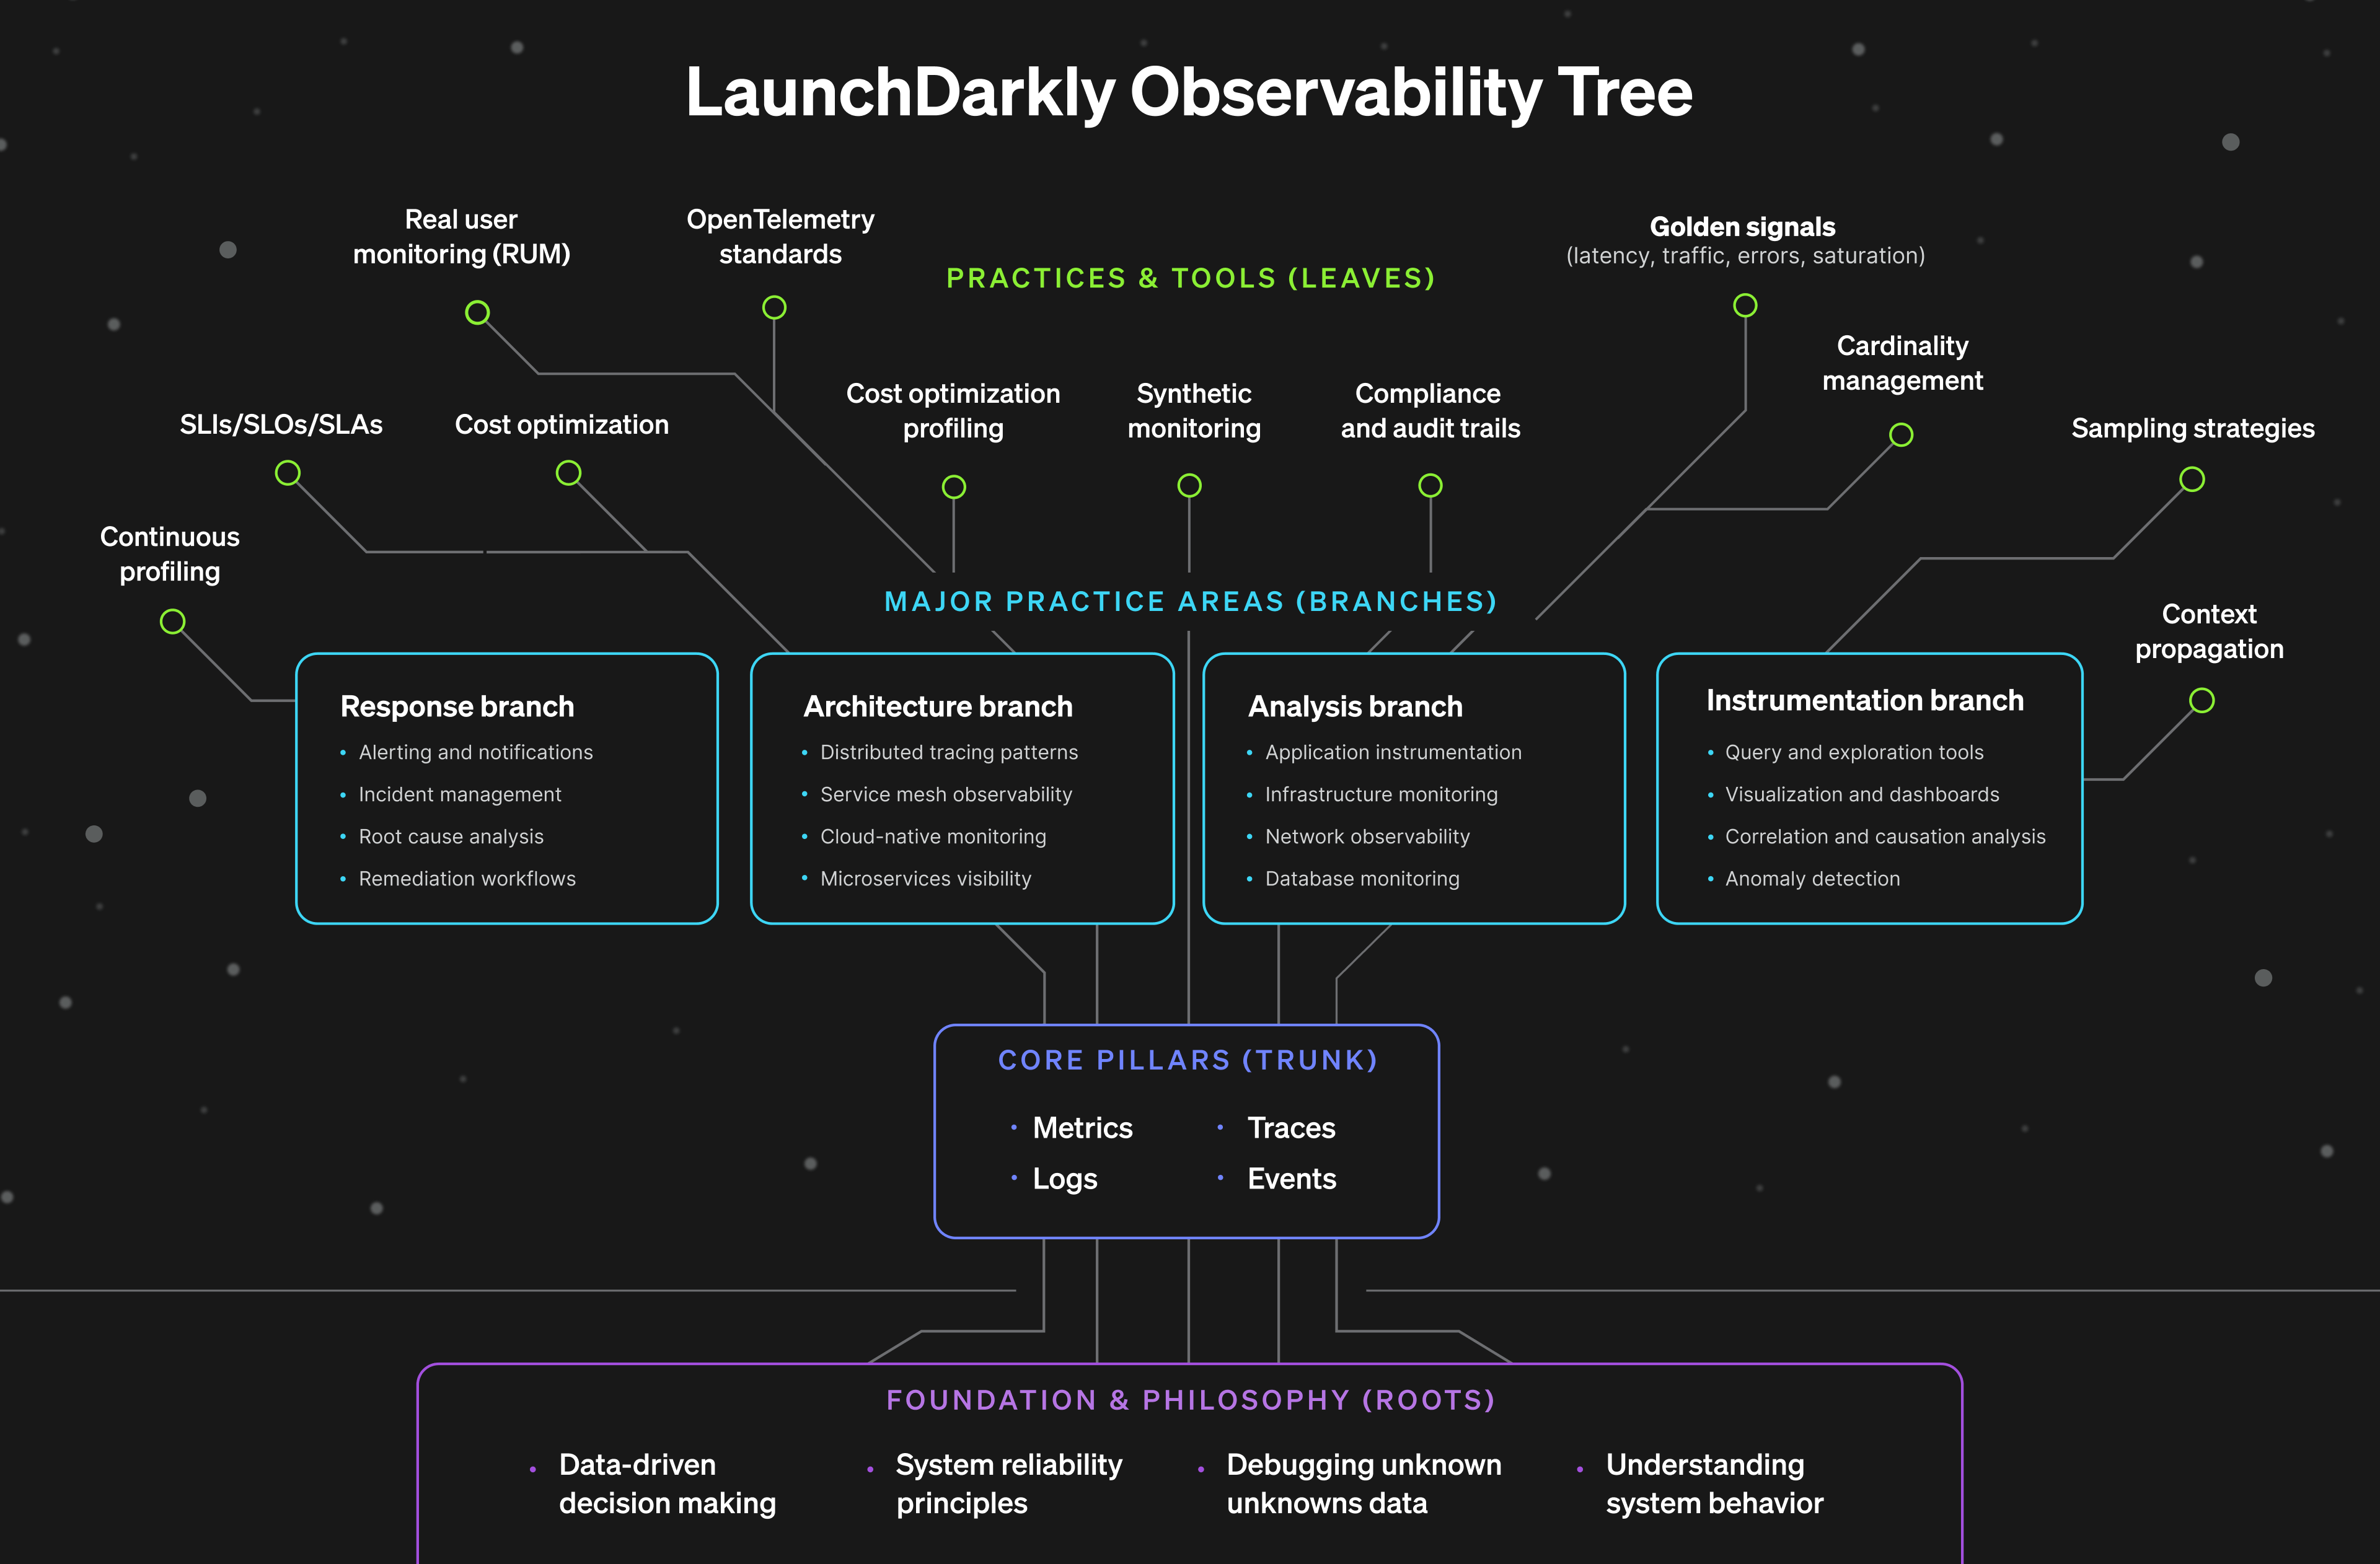
The layers of observability from the perspective of a tree metaphor.
What Makes an SLO Decision-Worthy
So what makes a good SLO? The goal of a SLO is to bridge engineering and business needs to support a high quality user experience. And a good SLO depends on three things, business clarity or asking the right questions, measurability, or can these components actually be measured, and actionable targets, or the game plan for when things go wrong. First, you need business clarity, which are the roots of the previously mentioned observability tree. This means articulating why something matters in concrete terms like dollars, users, retention and also avoiding vague statements like “uptime is important.” For instance, if I were measuring the impact of downtime on a checkout feature, I could establish the SLO scope with “each minute of checkout downtime costs us $12,000 in lost revenue based on our average transaction volume.” It is essential to be able to explain the business impact in one clear sentence. Second, you need measurability. This is like the trunk of the tree. Your SLO must connect to your golden signals such as latency, traffic, errors, saturation. This is where a lot of aspirational SLOs fall apart. Upper management might want to measure user happiness, but how can engineering translate this into actual metrics? Try to express the business impact in one clear sentence. If that’s difficult, it’s usually a sign the problem definition needs a bit more shaping before defining the SLO. Third, you need actionable targets, which represent the leaves on the observability tree. This is where most SLOs fail even when they get the first two right. There’s a number, maybe even a threshold, but no clear action plan. What happens when you miss it? Who gets paged? What gets paused? Decision-worthy SLOs specify exactly what happens at different levels of degradation, and more importantly, they give everyone the confidence to make decisions based on those levels.Building production resilient SLOs: LaunchDarkly’s Flag evaluation example
We can apply these same principles of building a production-worthy SLO using LaunchDarkly’s flag evaluation feature. The flag evaluation feature in the monitoring tab is an extension of observability where it tracks how often each flag variation is served to different contexts over time, and highlights flag changes that might affect evaluation patterns. Now, let’s build a SLO.Step 1: Start with the business question
What would be impacted if the flag evaluations monitoring feature broke? Customers use these charts to understand rollout progress, debug targeting issues, and verify that their flags are working as expected. If evaluation data is delayed or missing, they can’t trust what they’re seeing. They might roll back a working feature thinking it’s broken, or fail to catch a real problem because the charts show stale data. This undermines confidence in the platform and increases support load.Step 2: Translate to user experience terms
What does “working well” look like? When a customer makes a flag change and checks the monitoring tab, they see updated evaluation counts within a couple minutes. The charts load quickly (under 3 seconds). The data is accurate meaning evaluation counts match what’s actually happening in their application. If there’s a delay, we tell them explicitly rather than showing stale data as if it’s current.Step 3: Connect to telemetry
We track several golden signals for this feature.- Data pipeline latency: time from evaluation event to appearing in charts.
- Chart load time: how long it takes to render the monitoring page.
- Data accuracy: comparing our recorded evaluations against a known sample.
- Error rate: failed queries or chart rendering errors.
Step 4: Set the target
Based on that data, here’s our SLO: 98 percent of flag evaluation events will appear in monitoring charts within 3 minutes, with chart load times under 3 seconds at p95. Why these numbers? Customer research shows they expect “near real-time” monitoring, which they define as 2-3 minutes. Anything longer feels like stale data. Three seconds for chart loading is the threshold where users perceive delay and start questioning if something’s broken. We chose 98 percent instead of 99.9 percent because some evaluation events get sampled out intentionally for cost reasons, and occasional data pipeline delays from third-party dependencies are acceptable. Now that we have our targets, we can use those thresholds to set conditional responses based on alerts or indicators.Step 5: Define operational responses
Responses for Green, Red, or Yellow indicators in production:- If Green
(>98%, <3 min, <3 sec load), continue normal operations. - If Yellow
(95-98%, or 3-5 min, or 3-5 sec load), alert on-call, investigate within 4 hours. - If Red
(<95%, or >5 min, or >5 sec load), page immediately, update status page if widespread.