Components of a metric
This topic describes the key components of a LaunchDarkly metric. This is to help you understand how to create metrics for use with experiments, guarded rollouts, and release policies.
What is a LaunchDarkly Metric?
A LaunchDarkly metric consists of three distinct components:
-
Event: Metrics measure application events that occur when a user takes an action in your application, or when the application itself takes an action. LaunchDarkly SDKs generate metric events to track application events for a context. You use those events to create metrics. To learn more, read Metric events.
You can also use OpenTelemetry traces instrumented in your code to track application events. LaunchDarkly enables you to create metrics from traces for use with guarded rollouts. This enables you to reuse existing OpenTelemetry instrumentation without having to re-implement the same application measurements as metric events. To learn more, read Creating metrics from traces.
-
Aggregation method: During an experiment or guarded rollout, LaunchDarkly collects events for contexts that participate in the experiment or rollout. The metric aggregation method specifies:
- how LaunchDarkly aggregates multiple events that are collected for a given context
- the specific context kinds (analysis units) to use for measuring the metric
To learn more, read Aggregation method.
-
Analysis method: During an experiment or rollout, LaunchDarkly associates metrics with the flag variation that was served to each context. The analysis method specifies how to aggregate all of the collected metric data for all contexts that receive a given flag variation. To learn more, read Analysis method.
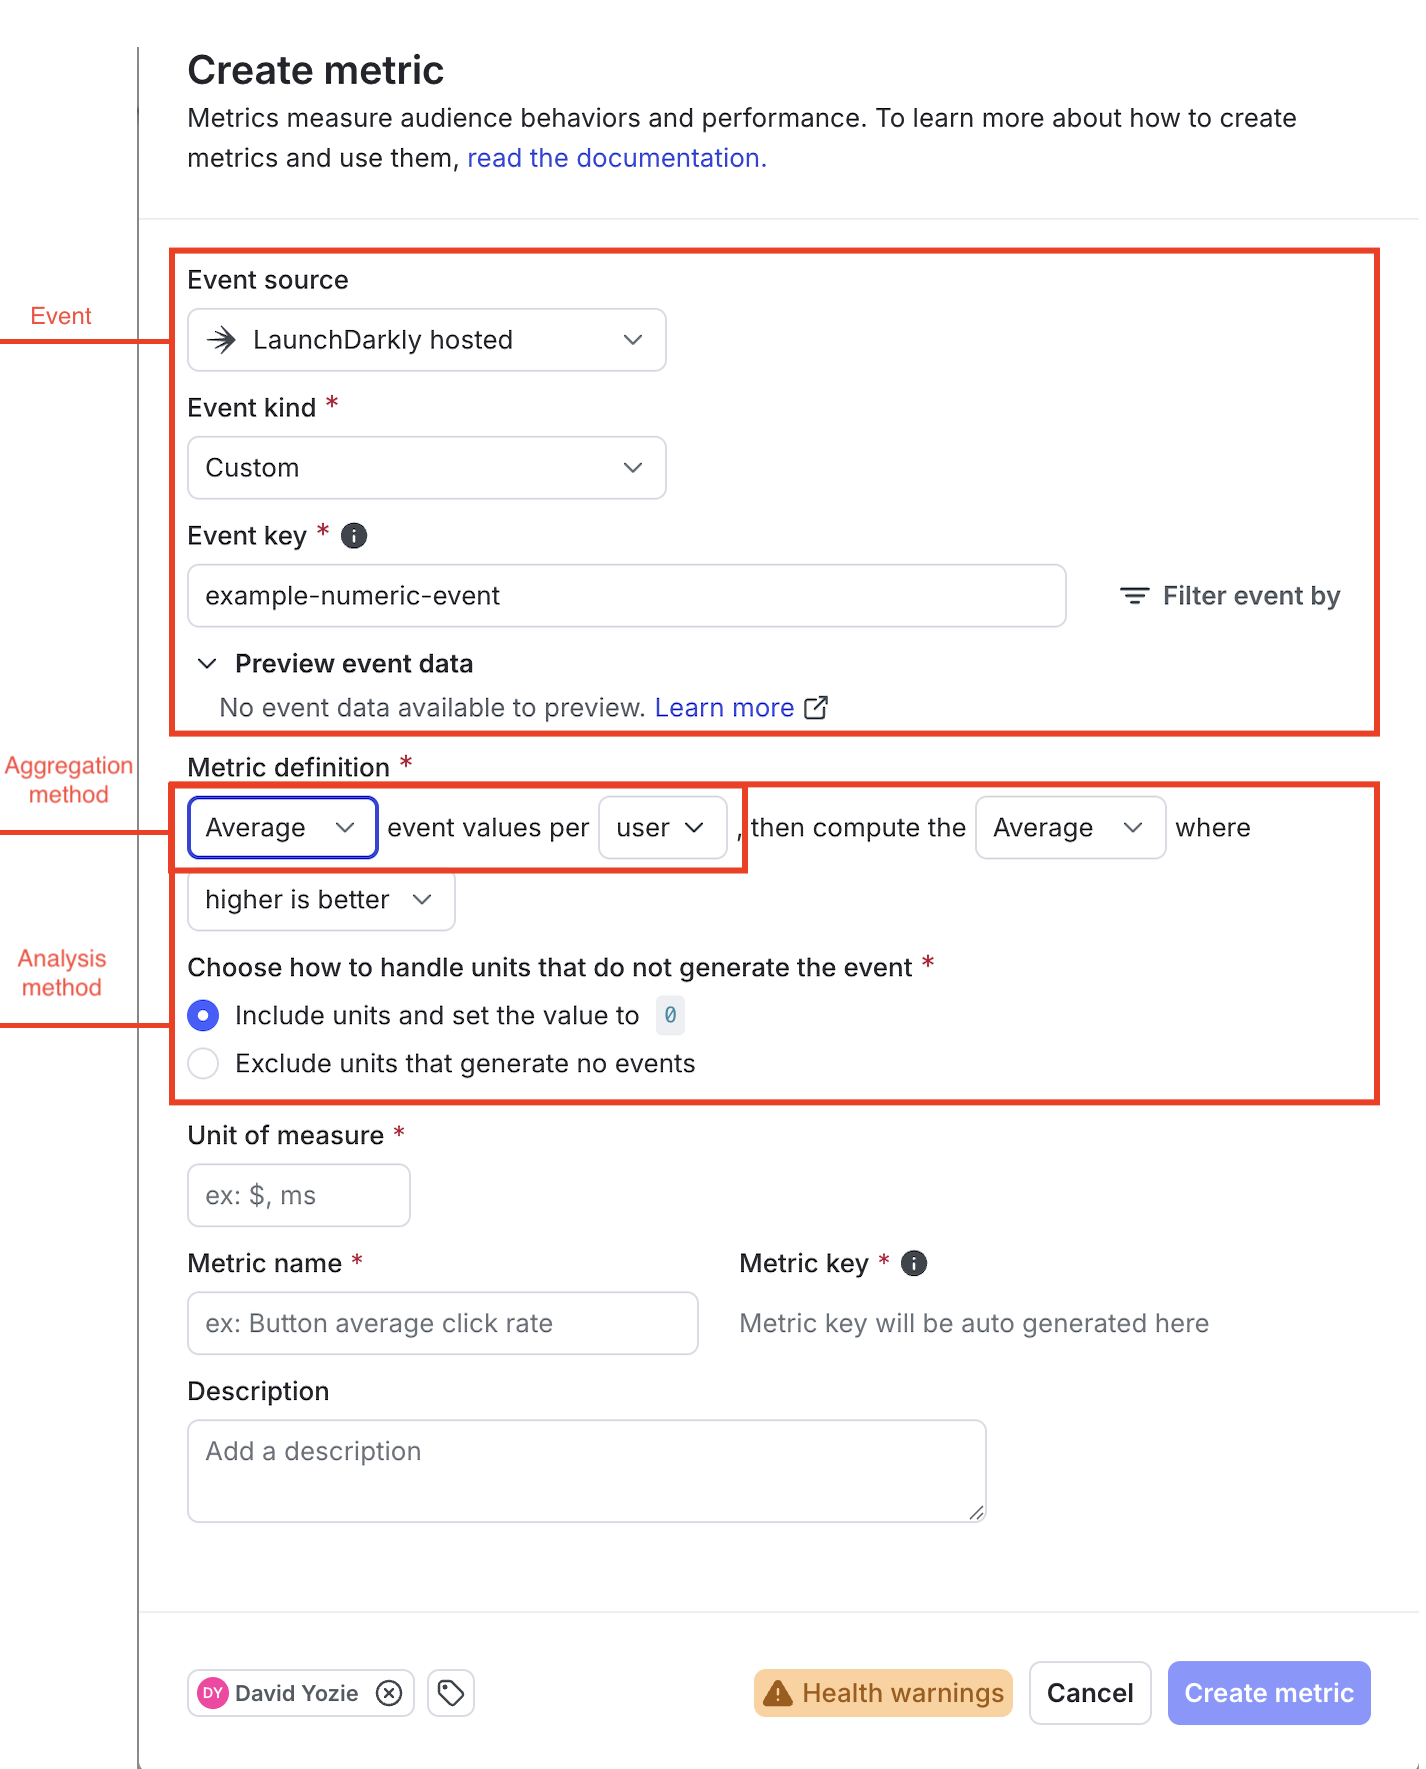
This screenshot shows where you configure the different components of a typical metric in the LaunchDarkly user interface (UI):
Metric events
Metric events can track discrete user actions, such as button clicks, page views, or completed transactions. Events that track actions are called conversion events, and are the most common metric events used in experiments. For example, you might create an experiment using a conversion metric to determine which flag variation results in more completed transactions, or more visits to a sign-up page.
Metric events can optionally produce a numerical value to track things like the duration of a transaction or the total amount of a purchase. Events that produce a value are called numeric metrics, and are typically used in guarded rollouts to measure latency or regression performance. For example, you might use a numeric metric with a guarded rollout to ensure that you only release a particular flag variation if it does not negatively impact performance for customers.
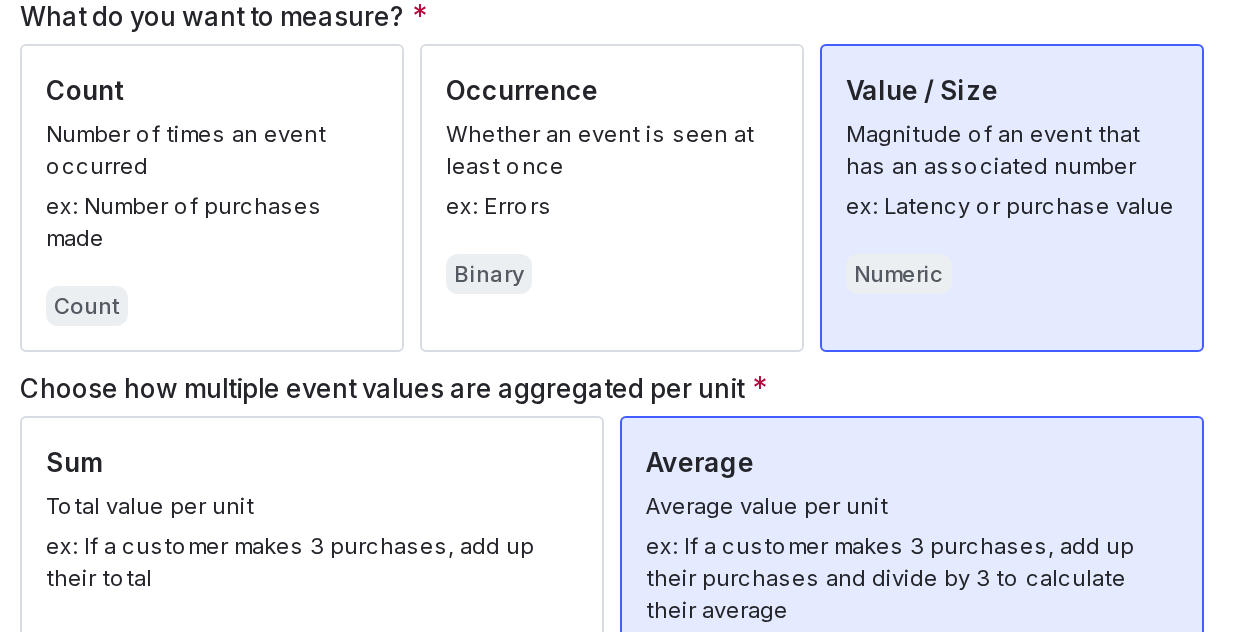
When you create a new metric in the LaunchDarkly UI, you begin by selecting one of the following metric event types:
-
Page viewed: These conversion events are generated when a customer visits a specific page in your application. You instrument page viewed events directly in the LaunchDarkly user interface when you create a new Page viewed metric. Page viewed events and metrics require that you use a supported client SDK. To learn more, read Page viewed conversion metrics.
-
Clicked or tapped: These conversion events are generated by customer activities such as clicking an application button or selecting an option from a page. Similar to page viewed events, you instrument clicked or tapped events directly in the LaunchDarkly UI when you create the new metric. You must use a supported client SDK to instrument clicked or tapped metrics events. To learn more, read Clicked or tapped conversion metrics.
-
Custom: Custom events can record either customer activities (conversion events) or system values (numeric metrics). For example, you can use custom events to track page views or click or tap actions with a server-side SDK. You can also instrument custom events to record the total time it takes to complete a transaction to measure regressions, or the total value of a completed transaction.
You must instrument custom events directly in your application code using the LaunchDarkly SDK
track()method. If your application has already generated custom events you can select the event key when you create a new custom metric. Optionally, you can specify a new event key to use when you create a custom metric; if you do this, ensure that you later implement the same key in your application withtrack()so that LaunchDarkly collects the configured metric. You can instrument custom events to provide optional metadata, which you can use locate and filter the specific events you want to include in a metric.All LaunchDarkly SDKs support creating custom events.
To learn more, read Events.
Aggregation method
The metric aggregation method specifies how LaunchDarkly aggregates multiple events that are observed for a given context during the course of an attached experiment or guarded rollout. It also specifies which analysis units (context kinds) to use for measuring metric events during an experiment or rollout.
You can aggregate events per context using either:
- the sum of collected event values
- the average of collected values
Funnel metric groups can only use metrics aggregated by average
Funnel metric groups can only include metrics that use the average aggregation method.
Ratio metrics support a third aggregation type, count_distinct, which aggregates a value independently of the metric event or event value. To learn more, read Aggregation for ratio metrics.
Analysis units
When you create a metric, you must select the analysis units used to measure events. You can choose one or more context kinds as analysis units.
A context kind identifies what generates the metric event, such as a user, a device, or a request. Select only those context kinds that generate the selected metric event. If a selected context kind does not generate the event, the metric’s health check displays a warning or failure.
Metric context kinds must match experiment or rollout randomization units
At least one context kind that you choose for an analysis unit must match the randomization unit used by any connected experiments or rollouts. The randomization unit for an experiment or rollout is the context kind used to target flag variations. To learn more, read Randomization units or Setting up contexts for guarded rollouts.
Some examples of common metrics and their analysis units include “sign-ups by user,” “clicks by user,” “purchase amount by user,” and “latency by request”:
Aggregation for conversion metrics
With conversion events, such as as page views or button clicks, LaunchDarkly assigns a value of 1 to indicate that an event was measured for a context during an experiment or rollout. Contexts that do not produce an event are assigned a value of 0. For example, consider a conversion event that tracks completed purchases in an online store. During an experiment, LaunchDarkly measures the completion event for two of the three contexts that receive a specific flag variation:
Aggregating conversion events by sum measures the count of events recorded for a given context during the course of an experiment or rollout. This type of metric is referred to as a count metric when creating a new metric or viewing labels in the metrics list. A count metric for the example events above uses sum aggregation to yield the values of 3, 0, and 2 for user purchases during the experiment.
Aggregating conversion events by average results in a metric that measures the occurrence of an event for a context during an experiment or rollout. This type of metric is referred to as an occurrence or binary metric when creating a new metric or viewing labels in the metrics list, because it results in either a 0 or 1 value to indicate whether the event occurred for a context. Creating an occurrence metric with the example measurements above uses average aggregation to yield the values of 3 / 3 = 1, 0, and 2 /2 = 1. With this metric a 1 indicates the user that made at least one purchase during the experiment.
Aggregation for numeric metrics
Numeric metrics also use the sum or average aggregation method to aggregate multiple event values for a given context. However, they use the actual numeric values collected from the metric events, instead of assigning 1 and 0 values to track actions as with conversion metrics. For example, consider a custom numeric event that tracks completed purchases in an online store and provides the total cart amount value with each event. During an experiment, LaunchDarkly measures the event for two of the three contexts that receive a specific flag variation:
Aggregating numeric events by sum measures the total of all event values recorded for a context during the course of an experiment or rollout. Aggregating by average measures the arithmetic mean of collected values per context.
User B in the above example has no aggregated values, because no events (and therefore no values) were recorded during the course of the experiment. For numeric metrics, the metric analysis method determines how to treat contexts in an experiment or rollout that did not generate metric events.
Aggregation for ratio metrics
Most LaunchDarkly metrics measure a single aggregation of events or event values per analysis unit. These are called simple metrics.
A ratio metric is a complex metric type that computes the ratio of two separate aggregations: one for the numerator component and one for the denominator component. LaunchDarkly divides the total of the numerator aggregation by the total of the denominator aggregation to compute the metric value. This lets you monitor the relationship between two different measurements during an experiment. For example, you can measure:
- The number of users who clicked on a search result relative to the total number of searches that were initiated
- The number of errors that the system generated relative to the total number of prompts
Each component of a ratio metric can use the sum or average aggregation methods. Ratio metric components can also use the count_distinct aggregation type, which is available in ratio metrics. The count_distinct aggregation provides the flexibility to measure a distinct signal independently of the metric event count or event value. When you configure this aggregation type, you provide the name of a warehouse column associated with the metric event to use for measuring distinct values.
To learn more, read Ratio metrics.
Analysis method
The analysis method determines how LaunchDarkly aggregates the collected metric values for all contexts that receive a particular flag variation during an experiment or rollout. You can analyze metric values using either the average (arithmetic mean) of collected values, or by using percentiles. To learn more, read Average analysis and Percentile analysis.
The analysis method also specifies whether LaunchDarkly should enforce a fixed metric measurement window or apply winsorization for warehouse native metrics.
For events that produce a numerical value, the analysis method determines how an experiment or rollout should handle contexts that did not generate metric events.
Finally, the analysis method specifies whether higher or lower metric values indicate success for the flag variation during an experiment or rollout. To learn more, read Units without events and Success criteria.
Average analysis
The average analysis method totals all of the aggregated metric values for all contexts that received a particular flag variation, and divides by the number of participating contexts. “Average” is the default analysis method.
Occurrence or binary metrics always use the average analysis method, which computes the percentage of contexts that produced the conversion event.
For conversion count metrics, average analysis computes the average or arithmetic mean number of conversion events per context.
For value metrics, average analysis also computes the average or arithmetic mean number of metric event values per participating context. You can choose to include contexts that did not generate a metric event during the experiment or rollout, but set their value to zero. To learn more, read Units without events.
Funnel metric groups require average analysis
Funnel metric groups can only include metrics that use the average analysis method.
Percentile analysis
The percentile analysis method computes the metric value measured by a selected percentage of contexts that receive a flag variation. When you choose percentile analysis, you can select from the following options:
- P50: the 50th percentile, which is also the median, is when half of the context measurements are above and half are below this number.
- P75: the 75th percentile is when 75% of the measurements are below this number and 25% are above this number.
- P90: the 90th percentile is when 90% of the measurements are below this number and 10% are above this number.
- P95: the 95th percentile is when 95% of the measurements are below this number and 5% are above this number.
- P99: the 99th percentile is when 99% of the measurements are below this number and 1% are above this number.
The closer the percentile is to 50, the closer it is to the median. Percentiles closer to the median, such as P75, are useful for analyzing general trends. For example, you might want to use the P50 or P75 methods for analyzing things like API latency.
Higher percentiles are better for detecting outliers. For example, if you have an endpoint that generally works well, but handles a single customer with large amounts of data poorly, you might want to use the P95 or P99 methods for the related metric.
Percentile analysis methods for Experimentation are in beta
The default metric analysis method is “average.” The use of percentile analysis methods with LaunchDarkly experiments is in beta. If you use a metric with a percentile analysis method in an experiment with a large audience, the experiment results tab may take longer to load, or the results tab may time out and display an error message. Percentile analysis methods are also not compatible with CUPED adjustments.
Measurement window
An optional metric measurement window defines a fixed, required period of time during which LaunchDarkly collects metrics for a context in a warehouse native experiment. To learn more, read Metric measurement window.
Winsorization
Winsorization is a statistical technique that replaces a metric’s outlying values with values at a configured percentile. To learn more, read Metric winsorization.
Success criteria
For metrics that use a custom event, you must indicate whether higher or lower metric values indicate success for a connected experiment or rollout:
- higher is better: choose this option for metrics that measure positive things like cart checkouts or sign-ups.
- lower is better: choose this option for metrics that measure negative things like errors or latency.
LaunchDarkly automatically sets the success criterion to “higher is better” for clicked or tapped metrics and page viewed metrics.
Units without events
Some contexts that receive a flag variation during an experiment or rollout will not generate the selected metric event. LaunchDarkly can use imputation to replace missing event values with a value of zero before performing the metric aggregation.
For metrics that measure conversion events, such as conversion count or binary metrics, LaunchDarkly always assigns the value of zero to contexts that do not generate an event. Imputing a value in this case accurately indicates that no conversion event occurred.
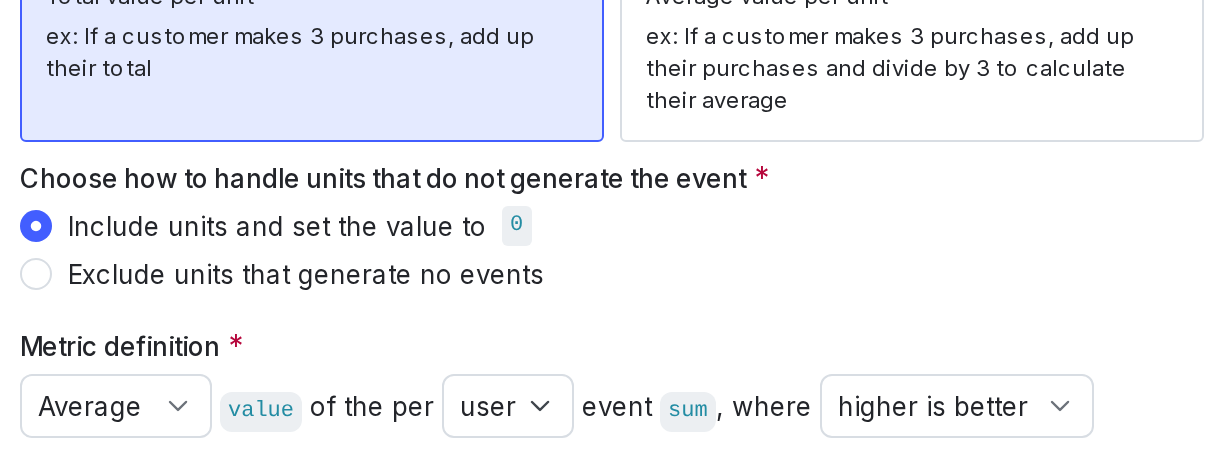
With numeric metrics that use average analysis, imputing a value for contexts that produce no events is sometimes not desirable. For example, if a metric event records a user satisfaction score, then assigning zero values to users that did not submit a review would negatively skew the average score. For this reason, LaunchDarkly lets you choose whether to impute the zero value for numeric metrics that analyze by average. You can choose to either:
- Include units and set the value to 0: this option is best for metrics where an incomplete process can be treated the same as zero, such as tracking cart totals for an online store. In this example, customers who put items in their cart but never completed the checkout process are treated as if they purchased $0.
- Exclude units that generate no events: this option is best for latency metrics. If LaunchDarkly never receives an event for a context instance, you do not want to default to zero because LaunchDarkly would interpret this as an extremely fast latency time, which would skew or invalidate the results.
Ratio metrics always include units and set the value to zero
Ratio metrics do not include these configuration options. Aggregations for the ratio metric numerator and denominator component always include zero values for units that do not produce a metric event.
If you choose Include units and set the value to 0 and you also configure metric winsorization, LaunchDarkly does not include assigned zero values when it computes the winsorization percentiles. To learn more, read Metric winsorization.