Feature monitoring
This topic explains how to use feature monitoring to evaluate the performance of a feature flag. Feature monitoring gives you visibility into whether a newly-released flag variation is causing any negative impacts to the user experience. You can asses a flag’s impact by monitoring flag-scoped observability charts for errors, logs, traces, and sessions.
You can use a flag’s feature monitoring charts to help you:
- Determine whether a specific flag variation is causing errors, performance degradation, or unusual log activity
- Identify the root cause of release issues by examining specific errors that occur after a user receives a flag variation
- Observe actual user interactions with different flag variations using LaunchDarkly’s session replay feature
- Gain confidence in progressive delivery by having immediate visibility into flag variation health signals
Prerequisites
Flag-scoped feature monitoring requires you to use the LaunchDarkly observability SDK plugins with a supported client-side SDK to record the necessary data. You can enable these plugins when you initialize the LaunchDarkly client in your app. To learn how, read Observability SDKs.
To view flag-scoped charts data for errors, logs, and traces, you require the LaunchDarkly observability plugin, which is available for certain client-side and server-side SDKs.
To view live session recordings associated with flag variations, you additionally require the LaunchDarkly session replay plugin, which is available only for certain client-side SDKs.
Feature monitoring charts
To view feature monitoring charts, navigate to a flag’s Monitoring tab and select one of available monitoring charts:
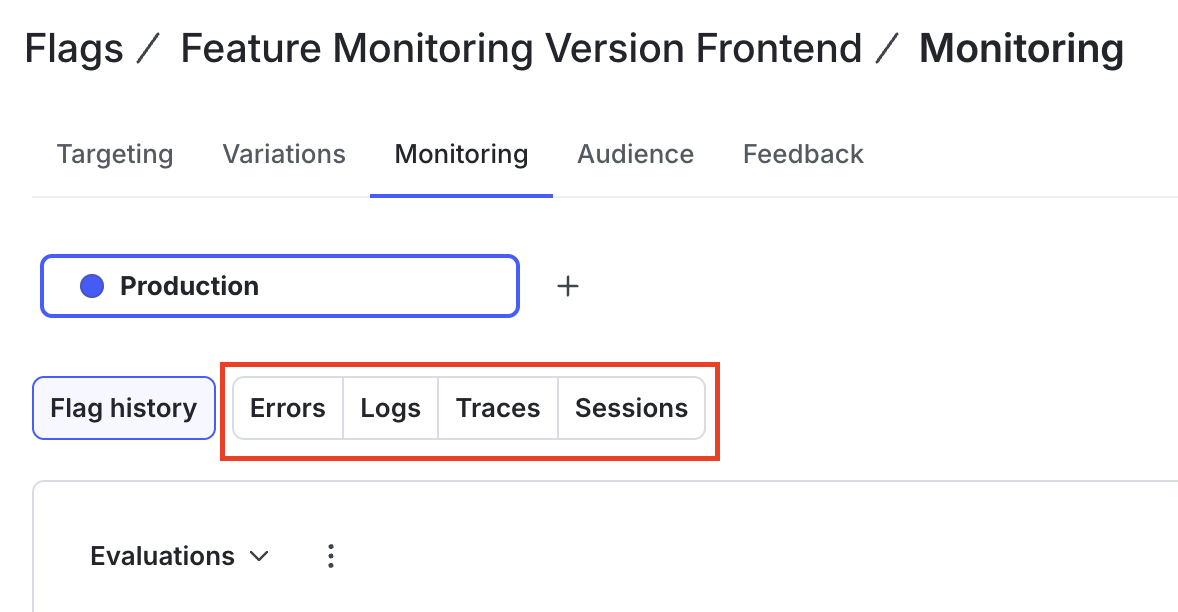
The “Errors,” “Logs,” “Traces,” and “Sessions” sections provide the corresponding observability chart for the selected flag. Data in each chart is automatically scoped to the flag you have selected, with results grouped by the flag’s variations. You do not need to cross-reference information in other areas of the product or apply filters to correlate the observability data with the selected flag.
Missing chart data
If you have not yet initialized a LaunchDarkly observability SDK plugin, the feature monitoring charts provide guidance to help you set up the observability feature. To learn more, read Observability SDKs.
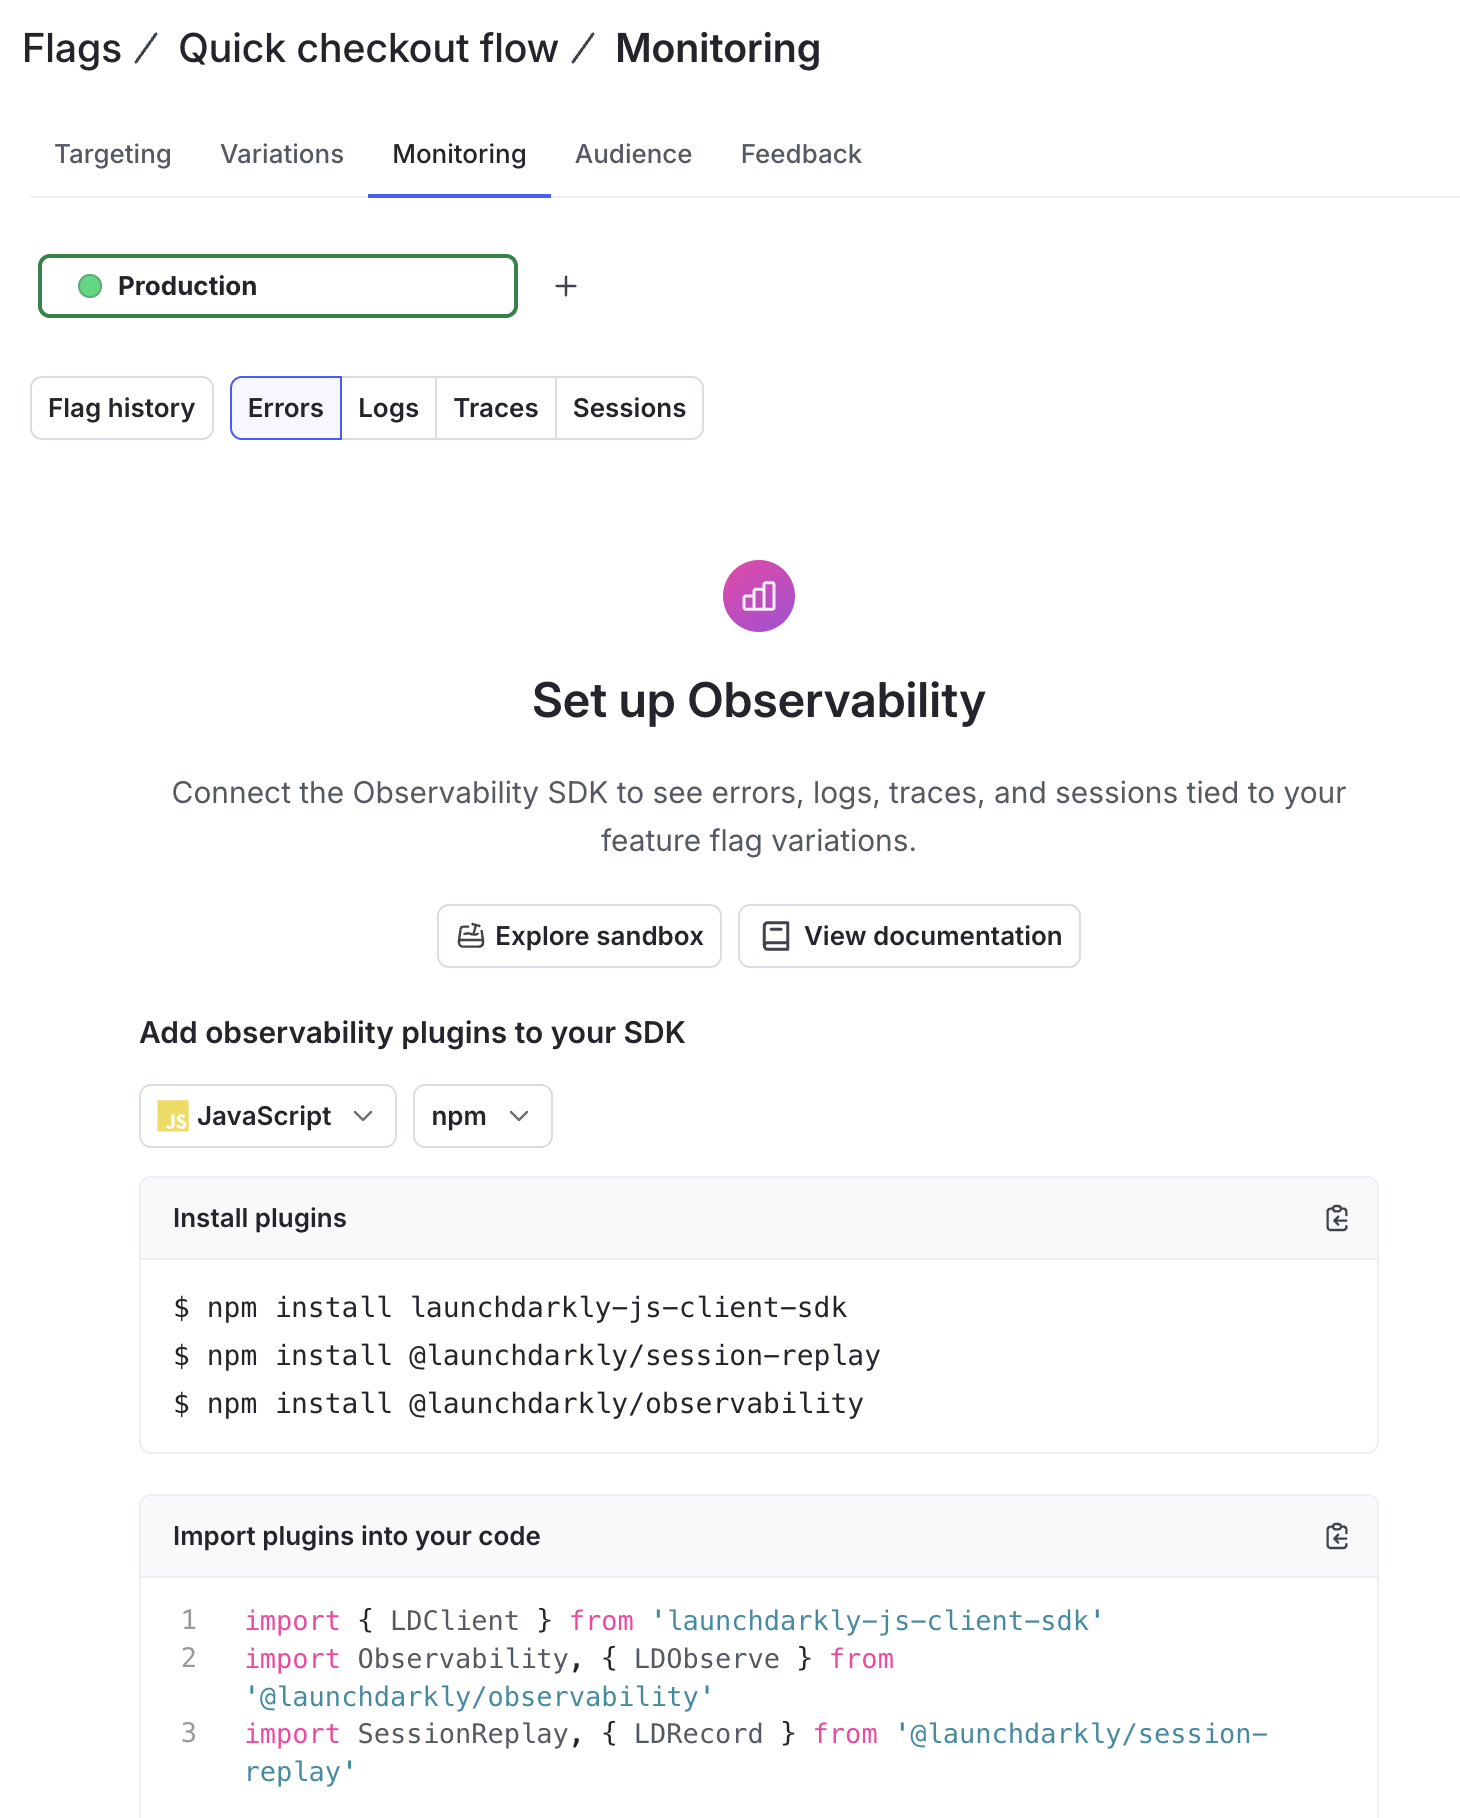
If you have initialized the observability SDK plugin but there is no observability data for the selected flag, individual feature monitoring charts may display the “No data available” message. This can indicate that the flag hasn’t yet generated telemetry data, or the flag variations aren’t instrumented to use the correct Launchdarkly observability plugin. To learn more, read Prerequisites.
All feature monitoring charts share a set of common features.
The main chart displays the volume of errors, logs, traces, or sessions over time, grouping counts by flag variation. Hover text for individual chart entries displays the count of items per flag variation. You can use the time range drop-down menu to change the scale of the chart. By default the chart displays data from the last seven days.
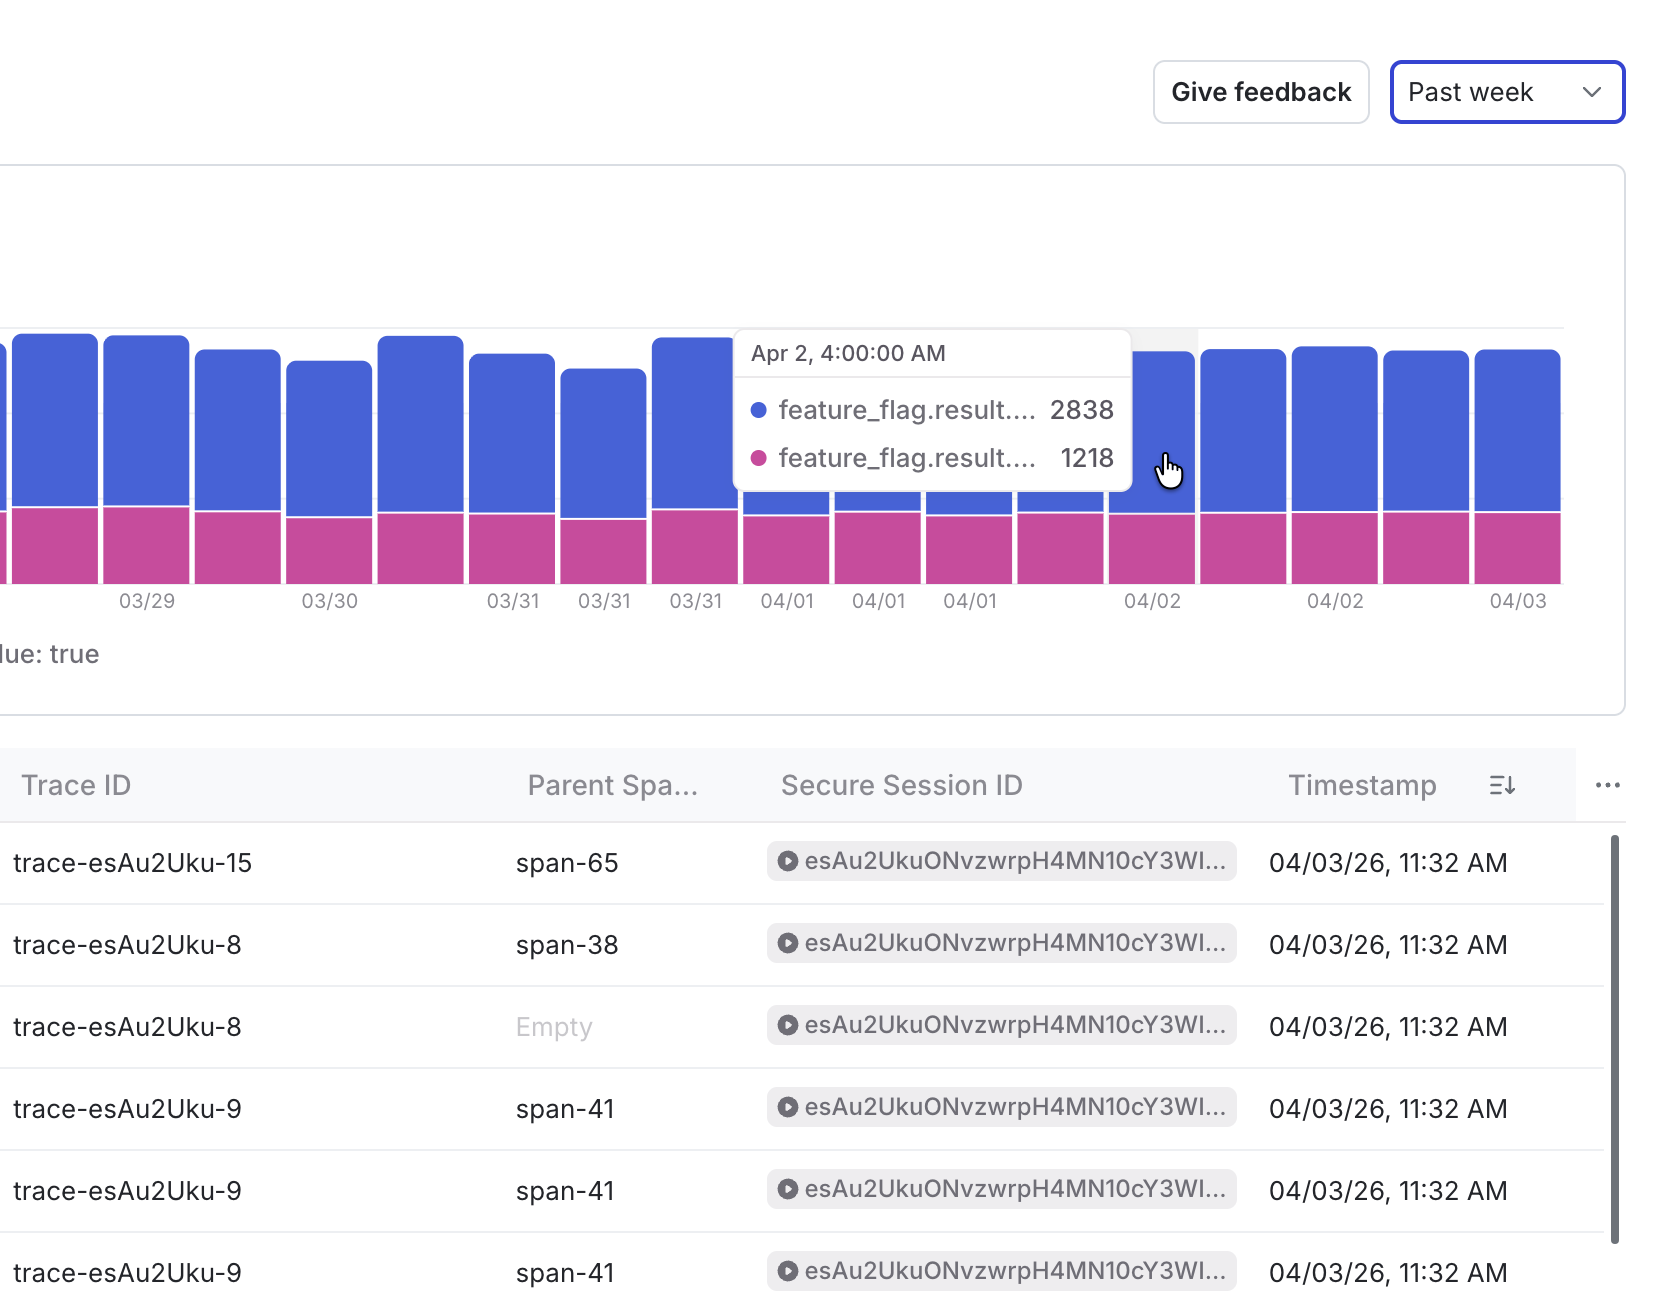
Listings beneath the chart show basic information for individual errors, logs, traces, or sessions. Use the three-dot overflow menu next to a column name to reposition or rename the column.
Use the three-dot overflow menu to the right of the columns to show or hide columns or to choose custom attributes to display as new columns. Click an entry in the first column to display details for the selected error, log, trace, or session.
Error monitoring
Use the “Errors” section to view all instances of errors generated by the selected flag’s variations. LaunchDarkly matches instances of an error using the error’s message or the top stack frame, if stack traces are enabled. Hover over an error instance in the errors list to highlight the count of occurrences for that error event in the chart timeline.
Click the name of an individual error event to display details about the error, including the number of users that experienced the error and a graph of error occurrences over the past 30 days.
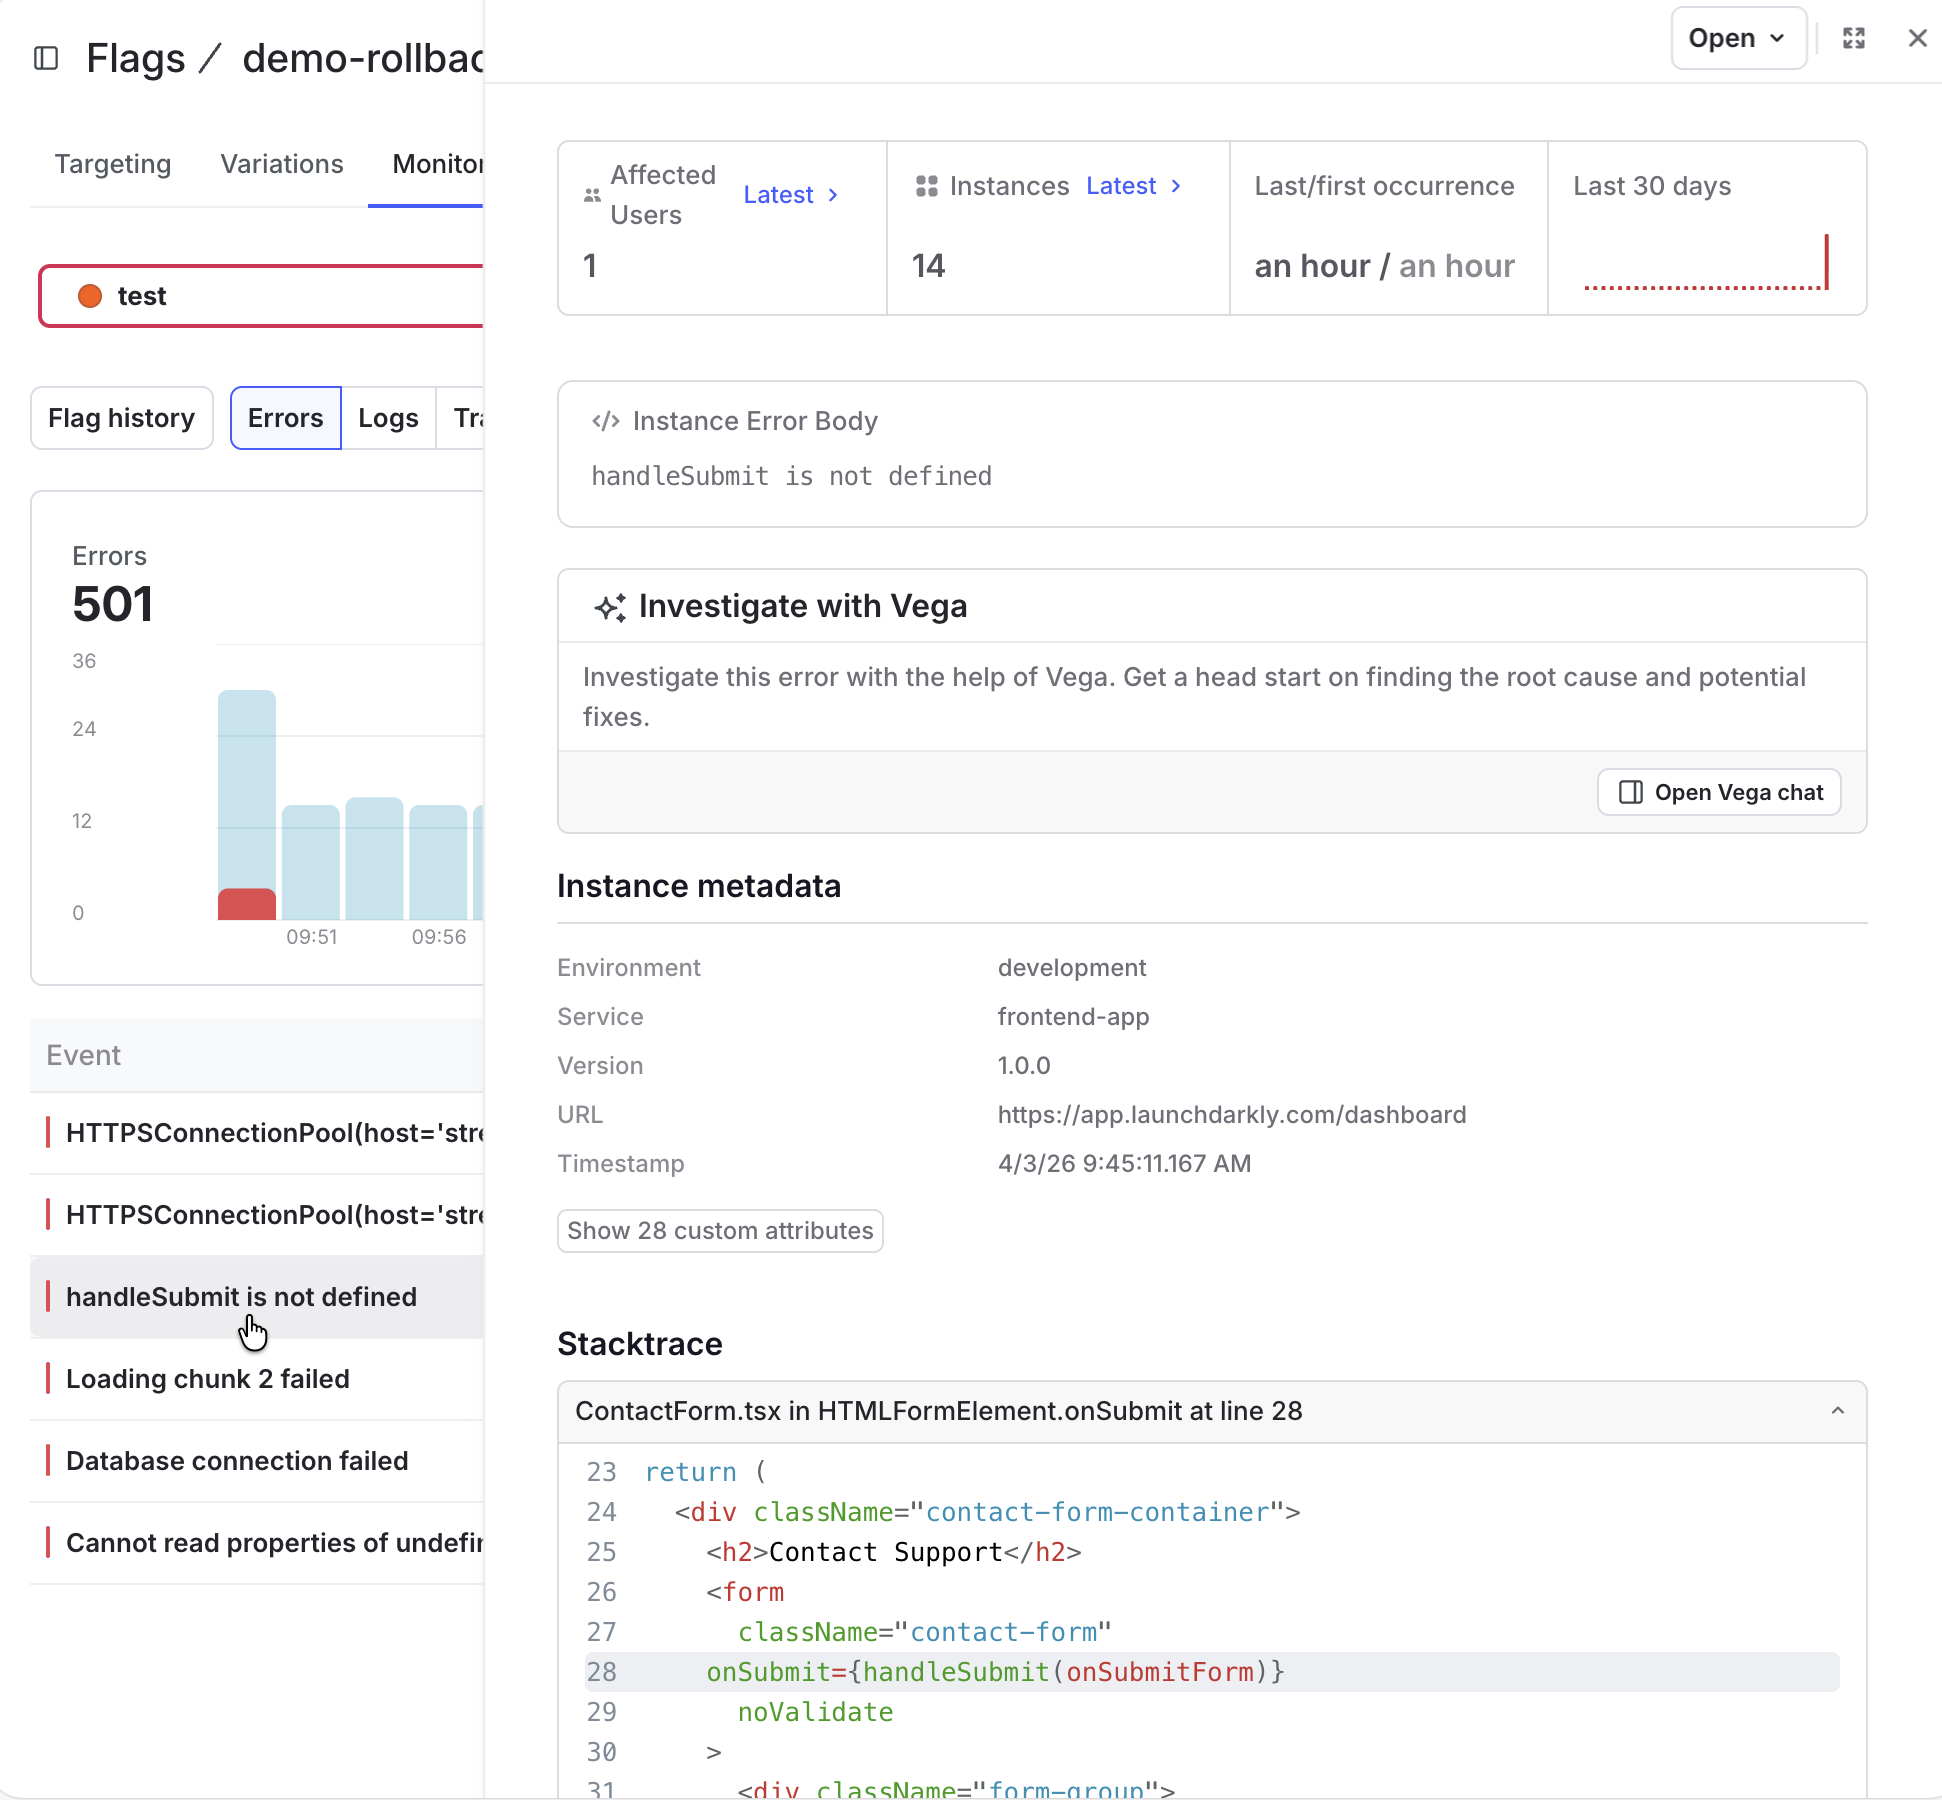
Expand the “Instance metadata” section in the error to view all available attributes available for the error. You can use these attributes to learn additional details such as the browser or operating system that encountered the error, as well as details about the LaunchDarkly SDK that was used. To learn more about error attributes, read the error monitoring topic for search attributes.
The “Stacktrace” section of the error detail page is available only if you include the sourcemap as part of your application, or if you have uploaded your sourcemap to LaunchDarkly. To learn more, read Use ldcli for uploading sourcemaps.
Log monitoring
Use the “Logs” section to view session log messages that were generated by the selected flag’s variations. Log entries are provided for all log levels, such as Debug, Info, Warn, and Error.
The default log list shows the log message and level, along with the general source that emitted the log event. Click a log entry to display all attributes available in the event, such as the LaunchDarkly environment that generated the log, or the code path or function that emitted the log. To learn more about available log attributes, read the log monitoring topic for search attributes.
Trace monitoring
The “Traces” section helps you view detailed information about how your application processed a request for a given flag variation. Because the traces chart provides details for all of the trace spans your application generated when interacting with different services, the amount of information can be overwhelming. For the purposes of flag variation monitoring, consider filtering the available data based on:
- Spans that involve particular services of interest (“Service Name” column), such as interactions with a database
- Spans that use specific versions of a service (“Service Version” column)
- Spans having high latency or that produce errors (“Duration” and “Has Errors” columns)
In addition to these general guidelines, you can filter spans using any telemetry attribute of interest, such as context type, flag key, browser, operating system, and so forth. To learn more, read the trace monitoring topic for search attributes.
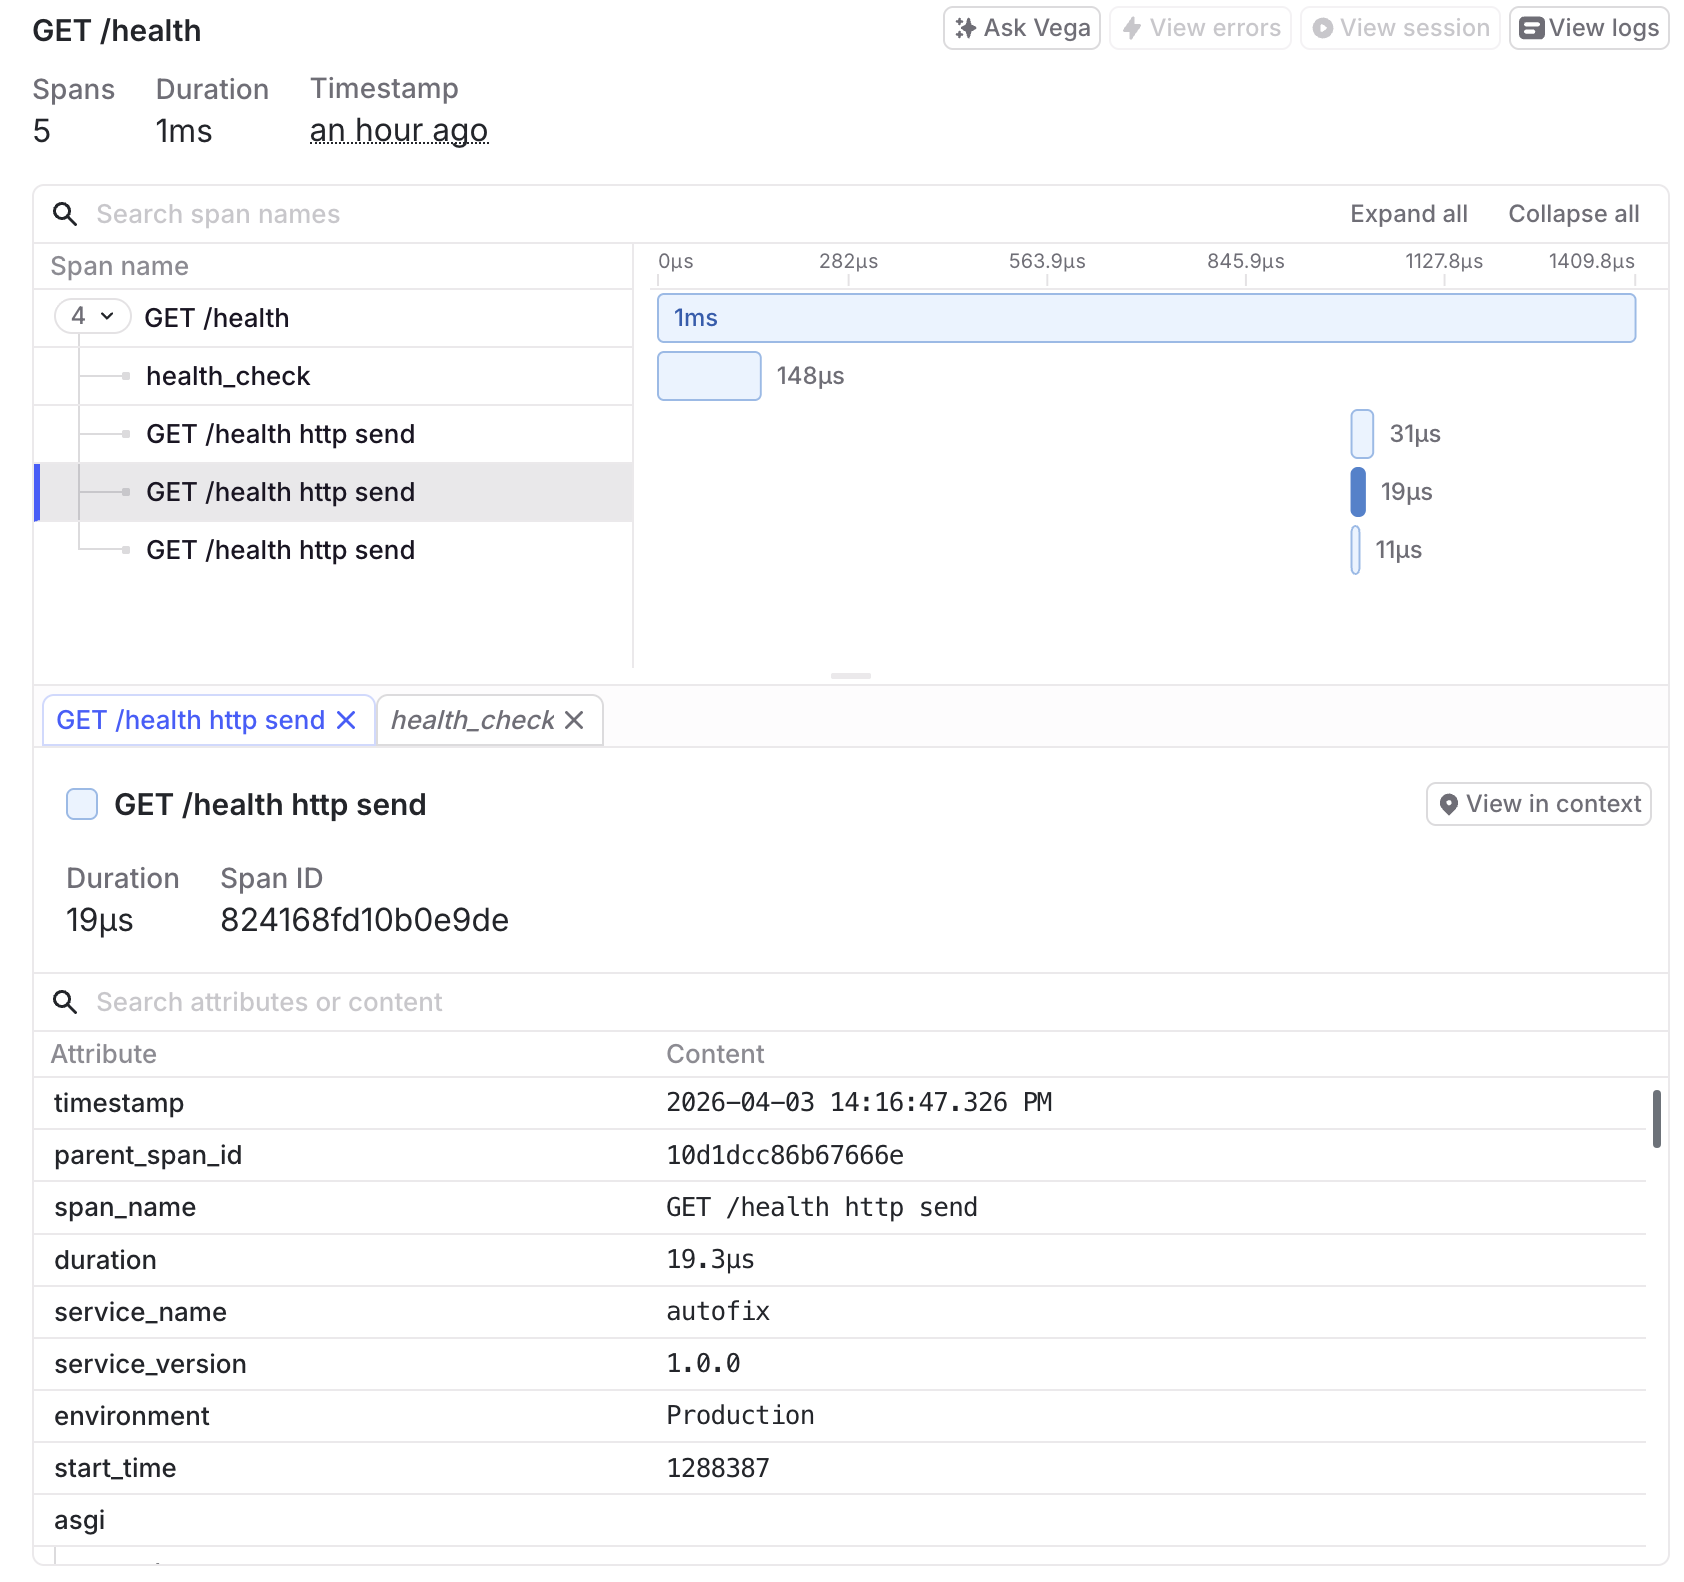
Click an entry in the “Span name” column to view full details for the span, including a visual representation of span duration and all available span attributes.
Session monitoring
Use the “Sessions” section to visually monitor user interactions that occur for different variations of the flag, as well as to inspect traces, flag evaluation, and performance data collected for the session. Visual replay of session data requires that your application use the LaunchDarkly session replay plugin. To learn more, read Prerequisites.
The main sessions chart displays the number of session recordings over time, grouped by variations of the selected flag.
Click an entry in the “Session ID” column to view the session replay and other monitoring data for the session.
Use the timeline controls to play, pause, or rewind the session replay, or to jump to specific user interactions recorded for the session.
Click the available subsection names to view additional details about the selected session:
- “General” shows the user, device, and environment information associated with the session, as well as all telemetry events recorded during the session. Click an available timestamp to jump to that event in the session replay.
- “Logs” shows all log messages generated for the session, with timestamp links for when each message was logged.
- “Traces” shows the span names, status codes, and span durations generated for the session, with timestamp links.
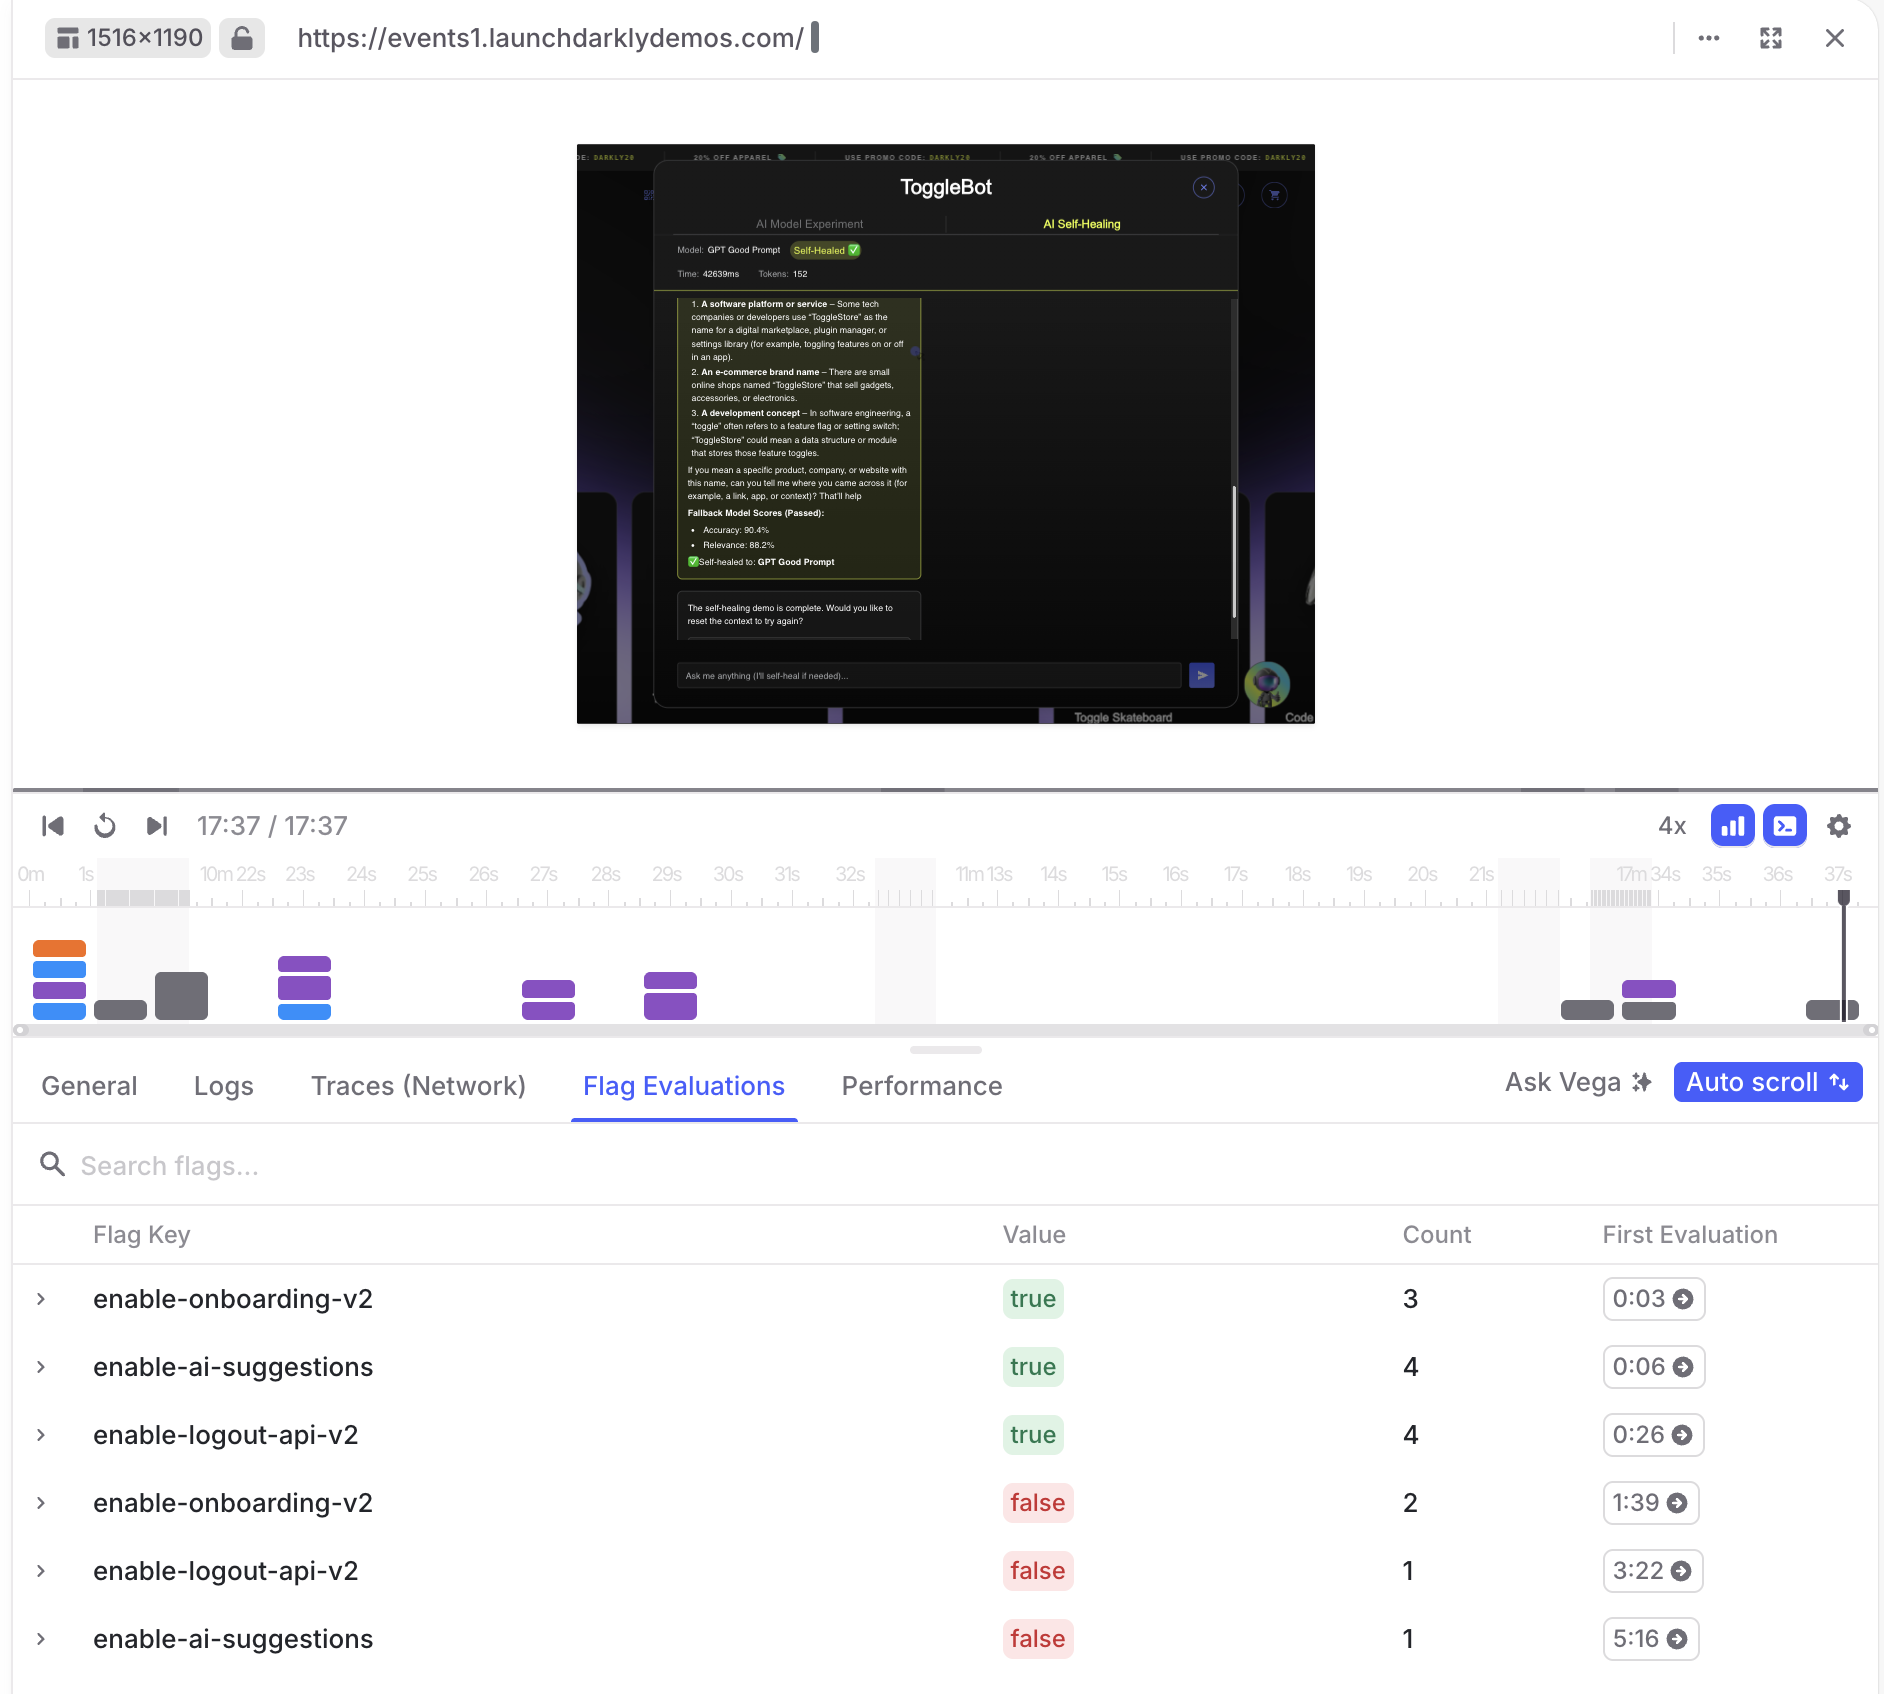
- “Flags” shows all flag evaluations that occurred during the session, along with the associated variation that was served and timestamp link.
- “Performance” shows general browser and rendering performance over the duration of the session.
To learn more about LaunchDarkly session reply, read Session replay.
Flag history
A flag’s Monitoring tab also includes the “Flag history” section, which provides general information about the flag’s evaluations and recent changes to the flag.
To learn more about flag evaluations, read Flag evaluations.
To learn about flag change history, read Change history.